Introduction: Rethinking Datacenter Design in the AI Era
In an era where artificial intelligence and the CyberPandemic is reshaping our technological landscape, it’s imperative to reconsider how we design and operate datacenters.
Over the last 30 years, datacenter construction has largely remained static, following a traditional model that is increasingly proving inadequate in the face of modern demands.
This approach has seen power requirements rise modestly from 5 kW to around 15 kW per rack – a figure that barely scratches the surface of what is needed today.
Contemporary datacenters, with their focus on real estate, risk becoming obsolete if they continue to neglect evolving needs.
As we stand at this technological crossroads, the urgency to adapt is clear: unless we pay close attention, new datacenters risk repeating the inefficiencies and security issues of their predecessors, leading to a poor utilization of investments and a significant mismatch with current and future requirements.
The 3 Main Design Flaws of Current Datacenters
Inadequate Power Provision
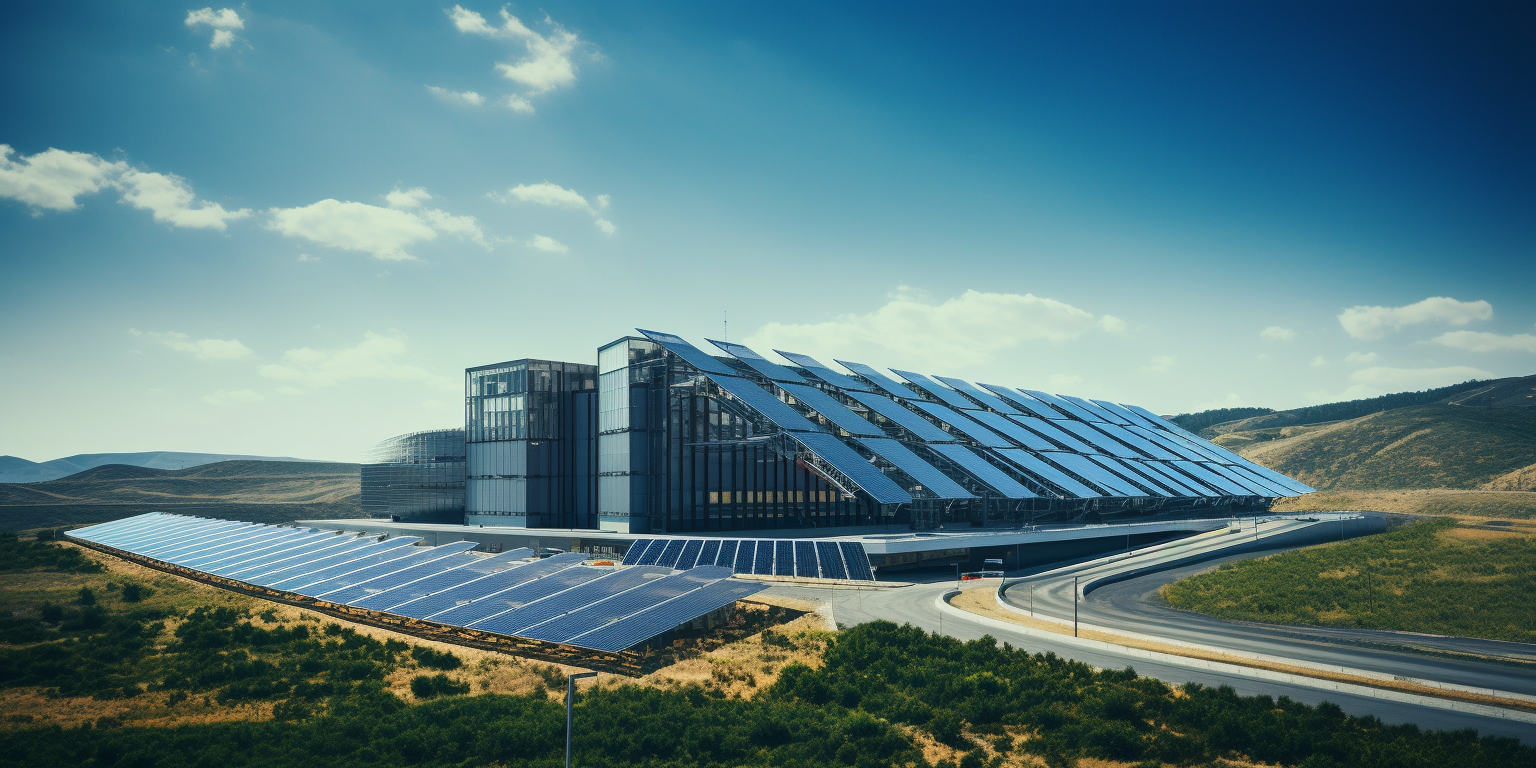
The advent of AI has dramatically escalated power needs. An AI-centric rack can consume up to 200 kW – a staggering 15 times more than the capacity of datacenters built in the conventional mold. This exponential increase poses significant challenges, particularly when dissipation exceeds 50 kW per rack. Traditional designs fall short in crucial aspects like cooling and power distribution, with conventional air cooling methods becoming increasingly unviable.
The Shift in Market Needs: Beyond Co-location
The market dynamics have evolved; selling space in a datacenter, akin to ‘advanced real estate’, is a model that’s rapidly losing relevance. The traditional co-location framework, which expects customers to manage their hardware and infrastructure within leased rack space, is becoming antiquated.
In the modern landscape, the role of a datacenter should transcend mere space rental. The emphasis should be on providing integrated solutions – selling compute, storage, and network capacity, not just rackspace and power. It’s about delivering a comprehensive service that aligns with the complex, ever-evolving needs of businesses immersed in the digital and AI revolution.
Cyber Pandemic
The Cyber Pandemic is real and leads to serious vulnerabilities and constant stream of hacking. To resolve this issue we need to start thinking about how we build new datacenters.
Conclusion
In conclusion, the dawn of AI demands a paradigm shift in how we conceive and build datacenters. It's no longer sufficient to adhere to the status quo. The future of datacenters lies in acknowledging and adapting to these emerging challenges – both in power consumption and service delivery. As the world moves forward, so must our approach to datacenter design and operation, transitioning from traditional real estate models to becoming dynamic hubs of technology and service provision.

Tiers
Tier 3 and 4 following Uptime Institute
The Uptime Institute is an organization that establishes standards and provides certifications for data center reliability and overall design.
- They developed the tier classification system that defines levels of redundancy and uptime for data centers, ranging from Tier 1 (basic) to Tier 4 (fault tolerant). This provides an industry standard for comparing data center resiliency.
- Their Tier Standards and Topology define specific availability and redundancy requirements for different data center subsystems at each tier level. This provides design guidance for engineers and architects aiming to build reliable facilities.
Tier S following ThreeFold
- ThreeFold has developed an autonomous self healing datacenter concept.

Tier 3
A Tier 3 data center is a type of data center facility that is designed to provide a high level of availability and redundancy for IT infrastructure and data storage. Tier 3 data centers are classified based on the Uptime Institute's Tier Classification System, which defines four tiers (Tier 1, Tier 2, Tier 3, and Tier 4) to categorize data centers according to their design and infrastructure capabilities.
Key characteristics of a Tier 3 data center include:
-
Availability: A Tier 3 data center is designed to ensure 99.982% availability, which means it allows for an annual downtime of no more than 1.6 hours. This high level of availability is achieved through redundant components and systems.
-
Redundancy: Tier 3 data centers feature redundant power and cooling systems, as well as multiple distribution paths for data. Redundancy ensures that if one component or system fails, there is an alternative in place to maintain operations without disruption.
-
Concurrent Maintainability: A Tier 3 data center allows for maintenance and repairs to be performed on infrastructure components without affecting the normal operation of the data center. This is achieved through the use of redundant systems and pathways.
-
Security: Security measures are typically in place to protect the data center against unauthorized access, including physical security, access controls, and surveillance systems.
-
Scalability: Tier 3 data centers are designed to accommodate growth and expansion of IT infrastructure, making them suitable for businesses with evolving needs.
-
High-Level Performance: These data centers offer high-speed connectivity, low-latency network connections, and advanced monitoring and management capabilities.
It's important to note that while Tier 3 data centers provide a high level of availability and redundancy, they are not as robust as Tier 4 data centers, which are designed to provide even higher levels of fault tolerance and uptime. The choice of data center tier depends on the specific needs and risk tolerance of the organization using the facility.
Power Requirements
-
Standard Range: Typically, the power availability per rack in a Tier 3 data center ranges from 4 kW to 10 kW. This range is sufficient for most traditional computing needs.
-
High-Density Options: For more demanding applications, such as high-performance computing or for racks densely packed with servers, Tier 3 data centers may offer high-density zones where power availability can range from 10 kW to 20 kW or more per rack.
-
Cooling Limitations: The upper limit on power availability is often determined by the data center’s cooling capacity. As power density increases, so does the heat output, which must be effectively managed by the data center’s cooling systems.
-
Custom Solutions: Some data centers can customize power availability based on client needs. This can include providing additional power circuits or designing a specific area of the data center with a higher power capacity.
-
Redundancy: Since Tier 3 data centers offer N+1 redundancy, there is always at least one backup for each power component. This does not directly affect the power available per rack, but it ensures consistent availability of the supplied power.
-
Scalability: Many Tier 3 data centers are designed to allow scaling of power and cooling resources as the needs of the customers grow.
When a business is considering colocation or hosting in a Tier 3 data center, it's important to assess its power requirements carefully. For operations with high power demands, it might be necessary to discuss with the data center provider the possibilities of allocating additional power resources or choosing a high-density zone within the data center. Data center providers typically measure power in kilowatts (kW) per rack and will have different pricing models based on the power and cooling requirements of the equipment hosted.

Tier 4
A Tier 4 data center is the most advanced type of data center tier, as classified by the Uptime Institute. These tiers are a standardized methodology used to determine availability in a facility. The Tier 4 data center is the most robust and less prone to failures. Its design ensures redundancy and reliability.
Tier 4 Data Center:
- Uptime: Designed for 99.995% availability.
- Redundancy: 2N+1 fully redundant infrastructure (the highest level of redundancy in a data center).
- Components: All components are fully fault-tolerant including uplinks, storage, chillers, HVAC systems, servers etc.
- Cooling: Fully redundant cooling equipment.
- Concurrent Maintainability: Everything can be maintained concurrently.
- Fault Tolerance: Fully fault-tolerant with the ability to sustain at least one worst-case scenario fault without impacting critical load.
- Power Paths: Multiple active power distribution paths.
- Downtime: Approximately 0.4 hours of downtime annually.
- Target Audience: Ideal for mission-critical operations such as large financial institutions, government data processing centers, and other high-demand networks.
Key Differences:
- Redundancy: Tier 4 offers 2N+1 redundancy, meaning there is a double system for power and cooling (plus an additional backup), while Tier 3 typically offers N+1.
- Fault Tolerance: Tier 4 is fully fault-tolerant, meaning that any single failure of components does not impact services, unlike Tier 3.
- Power Paths: Tier 4 data centers have multiple active power paths, whereas Tier 3 has multiple paths but only one active at a time.
- Downtime: Tier 4 data centers have significantly less downtime per year compared to Tier 3.
- Cost and Complexity: Building and maintaining a Tier 4 data center is significantly more expensive and complex than a Tier 3 facility.
Choosing Between Them:
- Cost vs. Need: Tier 4 data centers are significantly more expensive to build and operate. Organizations should assess whether they need the highest level of uptime and fault tolerance that Tier 4 provides.
- Business Requirements: Businesses that can afford occasional downtimes for maintenance or those that don't have extremely critical data operations may find Tier 3 facilities adequately sufficient.
- Industry Compliance: Certain industries may require or favor Tier 4 facilities due to regulatory requirements.
In summary, while both Tier 3 and Tier 4 data centers are designed to ensure high levels of uptime and reliability, Tier 4 takes this a step further with increased redundancy, fault tolerance, and a correspondingly higher price point.

Ideas
This section describes some ideas how a more efficient datacenter can be built.

AI Impact on Datacenter
The rise of Artificial Intelligence (AI) and machine learning (ML) has had a significant impact on data center design and operations.
1. High Power and Cooling Demands:
- GPU's can require more than 200 KW per rack, this means a 1 MWatt datacenter would only host 3 racks (rest is loss for cooling). Air cooling also becomes extremely difficult and expensive.
- Power Requirements: AI/ML hardware, especially dense GPU servers, consume significantly more power per rack than traditional servers, often necessitating enhanced power infrastructure.
- Cooling Solutions: The high power usage translates to increased heat output, requiring more effective cooling solutions, possibly including liquid cooling or advanced air cooling technologies.
2. Increased Computational Power:
- GPUs and TPUs: AI/ML workloads often require GPUs (Graphics Processing Units) or TPUs (Tensor Processing Units) for efficient processing. This leads to the need for racks that can support high-density GPU/TPU servers.
- Specialized Hardware: AI/ML applications require specialized hardware that can handle complex computations more efficiently than standard CPU's (huge GPUs).
3. Enhanced Network Infrastructure:
- Bandwidth and Latency: AI/ML workloads often involve large datasets, necessitating high-bandwidth and low-latency network infrastructure to efficiently move data in and out of the processing nodes.
- Interconnectivity: Enhanced interconnects are required for rapid communication between servers, especially for parallel processing tasks common in AI applications.
4. Large Scale Storage Solutions:
- Data Storage Requirements: AI/ML workloads typically require access to vast amounts of data. This necessitates large-scale storage solutions with high throughput and low latency.
- Data Management: Efficient data management systems are critical for AI/ML, as they often need to access and analyze large datasets.
5. Reliability and Redundancy:
- AI and ML workloads are often mission-critical, requiring high levels of uptime. This may lead to more stringent redundancy and failover requirements in data centers hosting these workloads.
6. Energy Efficiency:
- Given the high power demand, implementing energy-efficient designs and technologies becomes crucial to control operational costs and reduce environmental impact.
7. Scalability and Flexibility:
- AI and ML needs can scale rapidly. Data centers must be designed to easily expand and adapt to changing requirements, including the adoption of newer, more powerful hardware over time.
8. Security and Compliance:
- AI/ML workloads often involve sensitive data, necessitating higher levels of security and compliance with data protection regulations.
9. Edge Computing:
- Some AI applications, especially those requiring real-time processing (like autonomous vehicles or IoT devices), benefit from edge computing. This pushes some data center capabilities closer to the data source to reduce latency.
Some references
- https://www.upsite.com/blog/whats-driving-higher-rack-densities-in-the-data-center
- https://journal.uptimeinstitute.com/too-hot-to-handle-operators-to-struggle-with-new-chips/ (this isnt even for AI)

Immersive liquid cooling
Immersive liquid cooling is an advanced technique used in data centers to manage the heat generated by electronic components, particularly in high-performance computing environments like those with dense GPU configurations. This cooling method involves directly immersing computer components or entire servers in a non-conductive liquid. There are two main types of immersive liquid cooling: single-phase and two-phase.
Single-Phase Immersion Cooling
In single-phase immersion cooling, electronic components are submerged in a thermally conductive, but electrically insulating liquid. This liquid does not change its state; it remains a liquid as it absorbs heat. The process involves:
- Immersion: Hardware (such as motherboards, GPUs, and CPUs) is placed directly into a bath of cooling liquid.
- Heat Absorption: The liquid absorbs the heat generated by the electronic components.
- Heat Exchanger: The now warmer liquid is pumped through a heat exchanger, where it releases the heat, and then recirculated back into the cooling bath.
Two-Phase Immersion Cooling
Two-phase immersion cooling is more advanced. In this system, the liquid absorbs the heat from the components and then boils, changing its state from liquid to gas. The process involves:
- Boiling: The heat from the electronic components causes the liquid to boil and change into a vapor.
- Condensation: This vapor then rises to a condenser located at the top of the tank, where it cools and returns to a liquid state.
- Recirculation: The liquid is returned to the main tank to absorb more heat from the components, repeating the cycle.
Advantages of Immersive Liquid Cooling
- Efficiency: Liquid is more effective than air at absorbing and transferring heat, allowing for more efficient cooling, especially in high-density configurations.
- Reduced Energy Consumption: These systems can significantly reduce the energy consumption required for cooling, as the heat transfer is more direct and effective.
- Lower Noise Levels: Immersive cooling systems are quieter than traditional air-cooled systems since there are fewer fans and moving parts.
- Increased Hardware Lifespan: By maintaining consistent and optimal temperatures, these systems can prolong the life of hardware components.
- Space Saving: This cooling method can reduce the overall space required for cooling infrastructure.
- Overclocking Potential: Enhanced cooling efficiency can provide more headroom for overclocking CPUs and GPUs, potentially boosting performance.
Challenges and Considerations
- Cost: The initial setup cost for immersive liquid cooling systems can be higher than traditional air cooling systems.
- Maintenance: Maintaining and servicing hardware immersed in liquid can be more complex and time-consuming.
- Compatibility: Not all hardware is designed for or compatible with liquid immersion, and certain modifications may be necessary.
- Liquid Selection: The choice of liquid is crucial, as it must efficiently conduct heat while not damaging the hardware or posing safety hazards.
Immersive liquid cooling is particularly suitable for data centers that require high-density computing power and are looking to optimize energy efficiency and cooling effectiveness. As computational demands continue to grow, especially with the proliferation of AI and machine learning, immersive cooling technologies are becoming increasingly relevant.

Don't put all your eggs in one basket.
In times of conflict, datacenters emerge as primary targets. This was evident in scenarios like Ukraine, where just 4-5 significant datacenters became crucial points of vulnerability, leading to catastrophic outcomes when compromised. Beyond the threat of physical attacks, these centers are also susceptible to cyber-attacks and insider threats. Relying on centralized data storage and processing facilities poses a considerable risk to a nation's or an s critical digital assets.
The necessity for datacenters, especially for high-end computing tasks, is undeniable. However, their role in storage can be re-evaluated, and many computing functions can be effectively managed through alternative approaches. Distributed computing strategies, for instance, can mitigate some of these risks.
Implementing a network of smaller, strategically located datacenters across a country is a prudent step. Ideally, having at least 10 such facilities dispersed in key locations can enhance resilience. This approach not only diversifies the risk but also aids in efficient data distribution and management. A distributed network like this can maintain functionality even if some nodes are compromised, ensuring continuous operation and data integrity in challenging times.
We believe in a hybrid approach.
The strategy of combining larger datacenters with a network of smaller, distributed ones offers a complementary approach that leverages the strengths of both models while mitigating their respective weaknesses. This hybrid approach balances the need for high-power computing capabilities, redundancy, security, and efficient data management.
Advantages of Larger Datacenters
- High-End Computing Capabilities: Larger datacenters are better equipped to handle high-density computing tasks, especially those requiring extensive processing power like AI and machine learning workloads.
- Economies of Scale: They can offer cost efficiencies in terms of energy, maintenance, and staffing due to their size and scale.
- Advanced Infrastructure: Bigger datacenters often have the financial and technical resources to invest in cutting-edge technologies, security systems, and specialized staff.
Advantages of Smaller, Distributed Datacenters
- Resilience to Localized Failures: In case of physical or cyber-attacks, natural disasters, or power outages, having multiple datacenters ensures that the impact on the overall network is minimized.
- Reduced Latency: Smaller datacenters located closer to end-users can significantly reduce data transmission times, improving response times for local users.
- Flexibility and Scalability: They can be quickly adapted or scaled according to regional demands or technological changes.
- Enhanced Security Posture: A decentralized network makes it more challenging for attackers since compromising one site does not yield control over the entire network.
Complementary Approach: Balancing Both Models
- Strategic Placement: Larger datacenters can be established in major economic or tech hubs where high-density computing is most needed. Smaller datacenters can be distributed in less centralized areas to provide local services and back-up.
- Load Distribution: Critical, high-intensity tasks can be managed by larger centers, while decentralized nodes handle local data processing and storage, thus distributing the workload effectively.
- Enhanced Continuity and Redundancy: The larger datacenters can act as central hubs for backup and disaster recovery for the smaller centers, ensuring continuous operation across the network.
- Synergy in Operations: The smaller datacenters can act as edge nodes, preprocessing data for the larger centers, reducing bandwidth needs, and improving overall efficiency.
In summary, employing both larger and smaller datacenters in a complementary manner provides a balanced, robust, and flexible infrastructure. This hybrid approach not only enhances operational efficiency and data processing capabilities but also significantly improves resilience and security across the network.
Tier S Datacenter Reimagining Datacenters in the Age of AI
In an era where artificial intelligence and the CyberPandemic is reshaping our technological landscape, it’s imperative to reconsider how we design and operate datacenters.
Over the last 30 years, datacenter construction has largely remained static, following a traditional model that is increasingly proving inadequate in the face of modern demands.
This approach has seen power requirements rise modestly from 5 kW to around 15 kW per rack – a figure that barely scratches the surface of what is needed today.
Contemporary datacenters, with their focus on real estate, risk becoming obsolete if they continue to neglect evolving needs.
As we stand at this technological crossroads, the urgency to adapt is clear: unless we pay close attention, new datacenters risk repeating the inefficiencies and security issues of their predecessors, leading to a poor utilization of investments and a significant mismatch with current and future requirements.
single pod

Networking nicely integrated:

Maximum cooling capacity:
The most effective immersion cooling tank in the world. Merging state-of-the art engineering, integrated sensors with TFT screen, remote temperature monitoring & reporting service, with up to 64 kW heat transfer from single enclosure. DCX Enclosure has been designed for heat reuse applications – elevated temperature set point enables sustainable and effective heat utilization.
- Heat Transfer 35°C 40 kW
- Heat Transfer 25°C 45 kW
6 pod

The pod's are easy to maintain.

integration in std datacenter

capacity
Below is an example of what can be integrated in 1 pod
- 10 x 24 GB GPU system (AI workloads)
- 20 x CPU 16-24 cores each
- 40 TB high performance SSD (flash)
- 128 TB Storage Capacity
- 2560 GB memory

Tier-S Container System
Complete 40ft mobile immersion system combined with 2 x 2 MW Immersion Optimized Dry coolers and complete primary and secondary hydraulic systems with integrated switchgear system.
64 Pod's fit in 1 container
These are very powerful configurations ideal to build cost effective and hugely scalable datacenters.
The containers can be outside but often it makes sense to put then in warehouse style buildings, this provides better protection against the weather elements like sun, wind and rain. It also offers better physical protection.

Tier S Racks
Its possible to integrate liquid cooling in a rack approach, its a more expensive model compared to the Tier S Pod Approach.
The cooling system is fully redundant and capable to deliver upto Tier 4 Datacenter specifications level.
Quantum Safe Storage
A distributed storage system is deployed on top of the Tier-S POD's over multiple datacenters providing the best possible security and redundancy.

Any storage workload can be deployed on top of the Quantum Safe Storage System.
graph TD
subgraph Data Ingress and Egress
qss[Quantum Safe Storage Engine]
end
subgraph Physical Data storage
st1[In Liquid Storage Device 1]
st2[In Liquid  Storage Device 2]
st3[In Liquid  Storage Device 3]
st4[In Liquid  Storage Device 4]
st5[In Liquid  Storage Device 5]
st6[...]
qss -.-> st1 & st2 & st3 & st4 & st5 & st6
end
ZDB are the low level databases which live inside the 3Nodes, a 3Node is like a computer which is installed inside a pod.
The low level storage devices are submerged in the liquid cooling pods. None of the pod's has enough information to make it possibel to restore the data.
The pod's can be over multiple location and as such the most reliable and secure storage system can be created.
Tier-S Auditing and Reporting
All provisioning actions as executed on the digital backbone get registered on a quantum safe storage system and the proofs on a blockchain system.
Strongly authenticated users can access a dashboard web interface to consult the Control Backbone Dashboard.
graph TB

    subgraph GOV[Government]
        Gov1[Super User] --> Search
        Gov2[Super User]
        Gov1 --> Gov2
    end

    subgraph BC[Control Blockchain]
        Validator6 ---|upto 99 validators| Validator1
        Validator1 --- Validator2
        Validator2 --- Validator3
        Validator3 --- Validator4
        Validator4 --- Validator5
        Validator5 --- Validator6
    end

    subgraph DB[Quantum Safe Storage System]
        DB5 --- DB1[DB Storage System 1]
        DB1 --- DB2
        DB2 --- DB3
        DB3 --- DB4
        DB4 --- DB5
    end


    subgraph Auditing[Audit Monitor Cluster]
        Monitor[Monitoring]
        Monitor --> Audit[Auditing Engine]
        Reporting[Reporting] --- Audit
        Search[Dashboard] -->Audit
        Audit --> DB1
        Audit --> Validator1
        Reporting --> Gov2
    end
Information Available
- Detailed monitoring of all operations
- Key Performance Metrics
- Billing Records
- Resource Utilization Records
- Audit Records
- ...

Tier S Circular
S stands for Self Healing and can be seen as extensions to Tier 3 and 4 datacenters.
Tier-S datacenters are compatible with Tier 3 and most of Tier 4 but they have additional benefits:
Principles
- The Tier S Circular approach allows to build the most reliable and redundant datacenters in the world.
- A larger datacenter typically 2-10 mwatt capacity is extended with at least 9 edge datacenters.
- Each edge datacenter is on a ring and can be 3 to 30 pods.
- The main datacenters can be pod, rack based on container based.
- A Tier-S datacenter can be Tier 3 or Tier 4 capable but is constructed in more modern ways.
More Info
Benefits
reliability
- storage can never be lost
- data can be spread over multiple sites in such a way that not even quantum computers can hack
redundancy
- all pods are liquid cooled (submerged)
- liquid cooling is a much more simple and reliable process
- all power paths and network pats are fully redundant
war and natural disaster proof
- the circular design with main datacenter and edge datacenters makes it much harder to bring a datacenter down in a situation of nautral disaster, war or other unrest.
self healing
A tier S datacenter, has self healing properties, the aim is that workloads can run in all safety and don't need human super administrators to keep alive.
Generating Electricity Sustainable is becoming super important
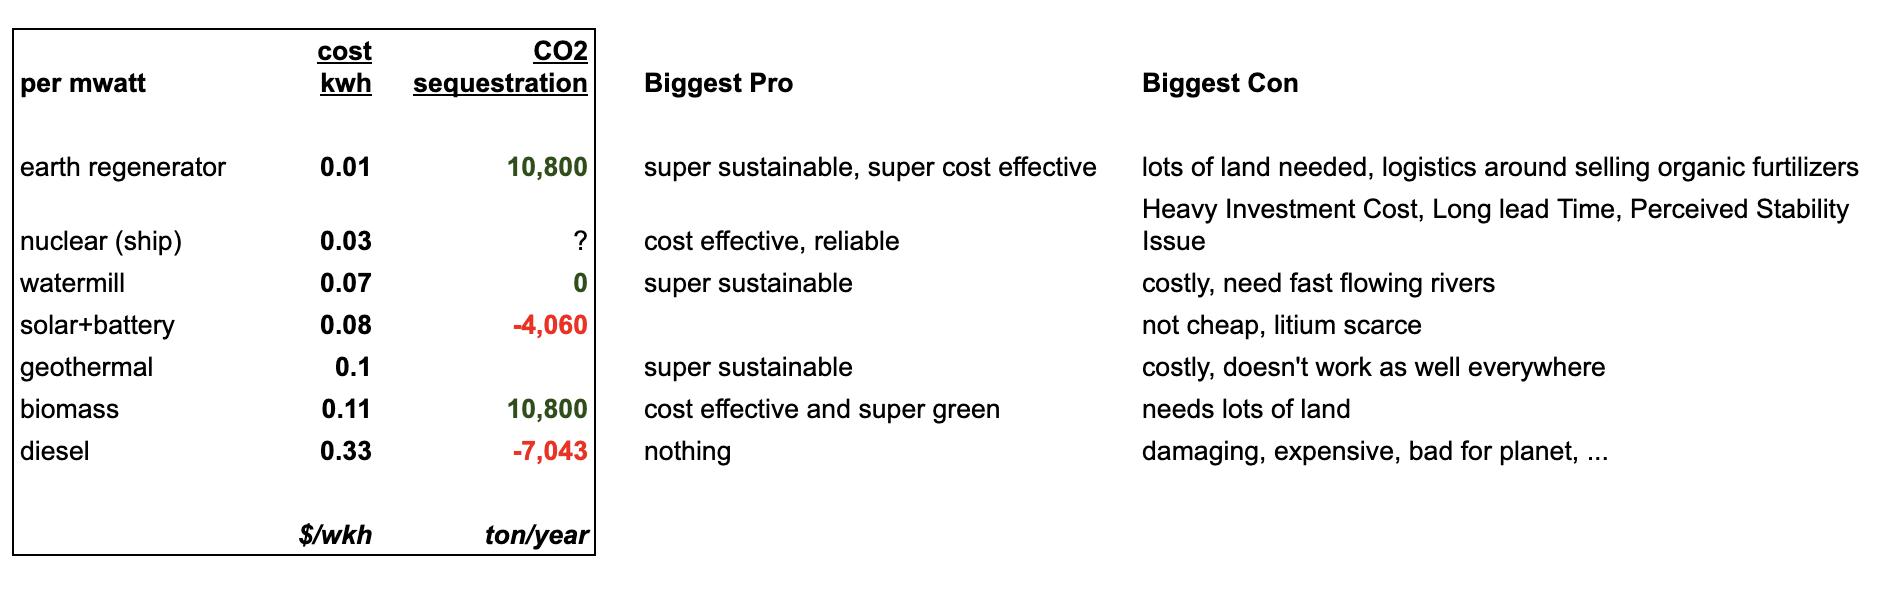
Possibly from best to worst at this stage
Earth Regenerator
- exciting new possibility, cost price is amazing
- planet impact is wonderful
- biggest downside is that this is new technology and requires early adopters
- do note that this approach requires a lot of land to produce the biomass
Nuclear
- probably still a good option at this stage especially when using generation 4 nuclear plants.
- cost price of electricity is great
- the upfront cost is sizeable and it takes years to build
BioMass
- proven technology, capex is low to get started
- do note that this approach requires a lot of land to produce the biomass
Solar
- not a bad option but still produces carbon
- capex is rather high
- cost price is not bad
Diesel
- to be avoided, its just a very bad option
energy mix
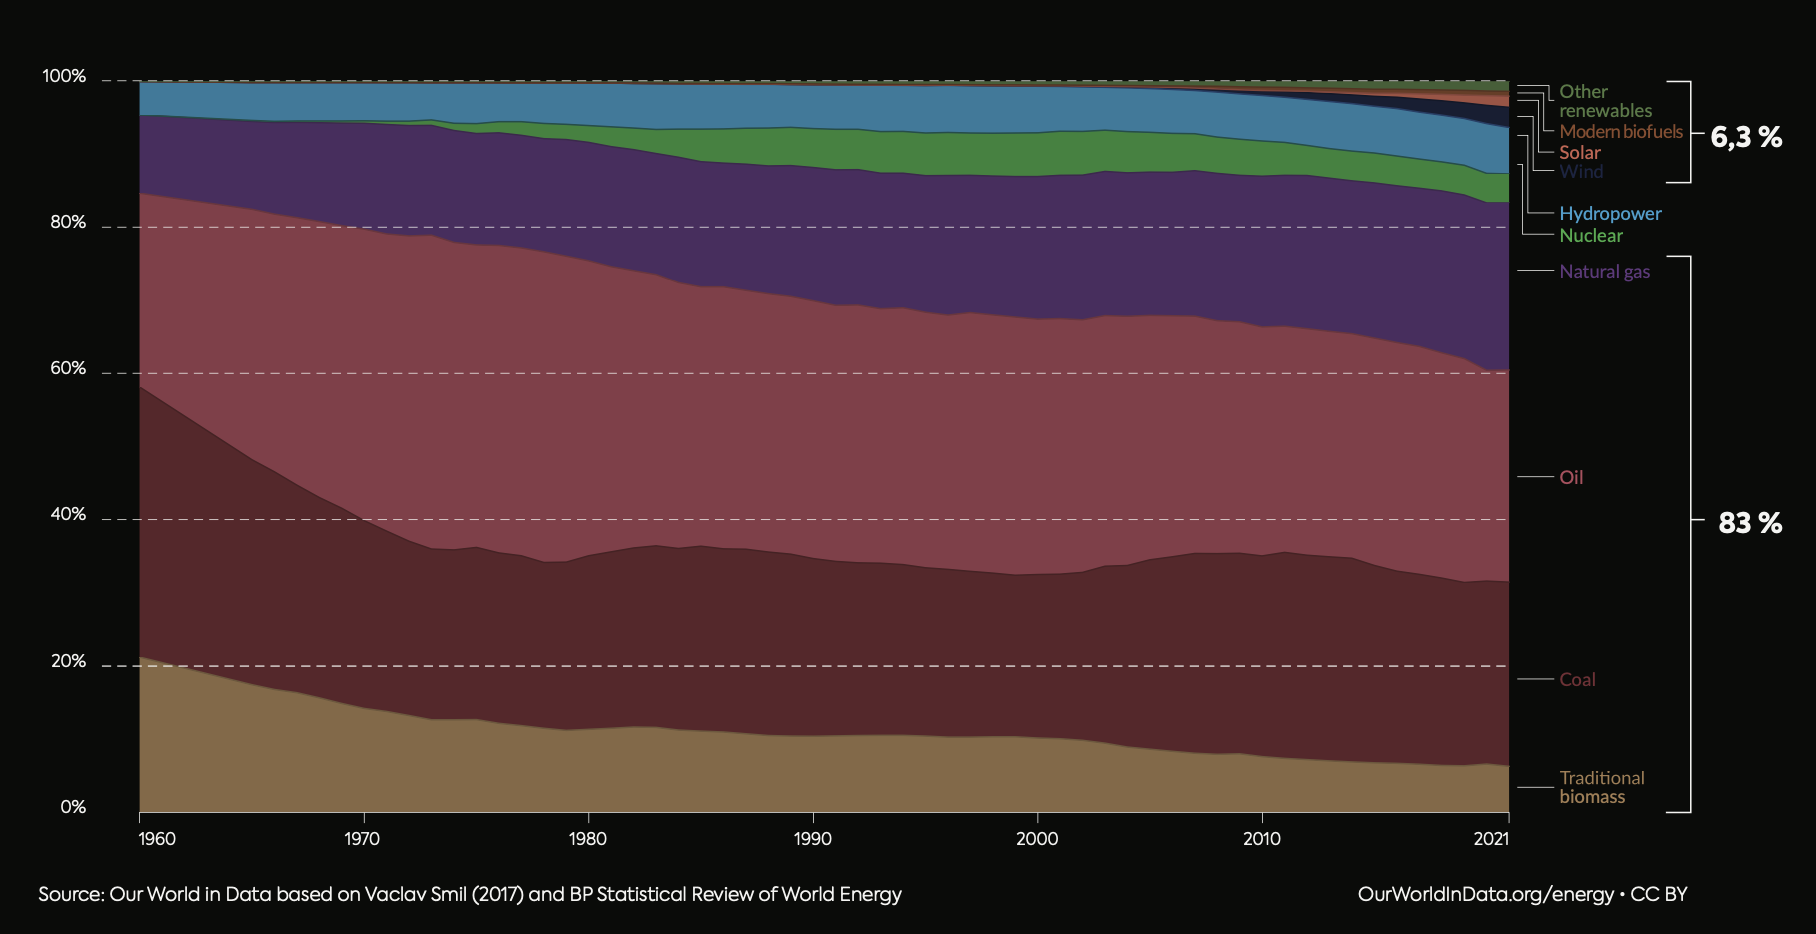
The world's reliance on fossil fuels remains a significant challenge, given its unsustainable nature and prevailing dominance in our global energy consumption. This ongoing dependence is compounded by economic uncertainties and geopolitical instabilities.
Presently, renewable energy solutions, despite their growth, still face issues with consistent and stable supply, and are not yet universally accessible on demand.
In essence, moving away from fossil fuels is not just a matter of environmental responsibility, but a critical necessity for our continued existence.
To better understand this dynamic, it's useful to examine global primary energy consumption by its sources. This involves assessing the production capabilities of various fuels, including how non-fossil energy sources could be transformed to match the energy output of fossil fuels, accounting for similar conversion inefficiencies.
planned energy mix
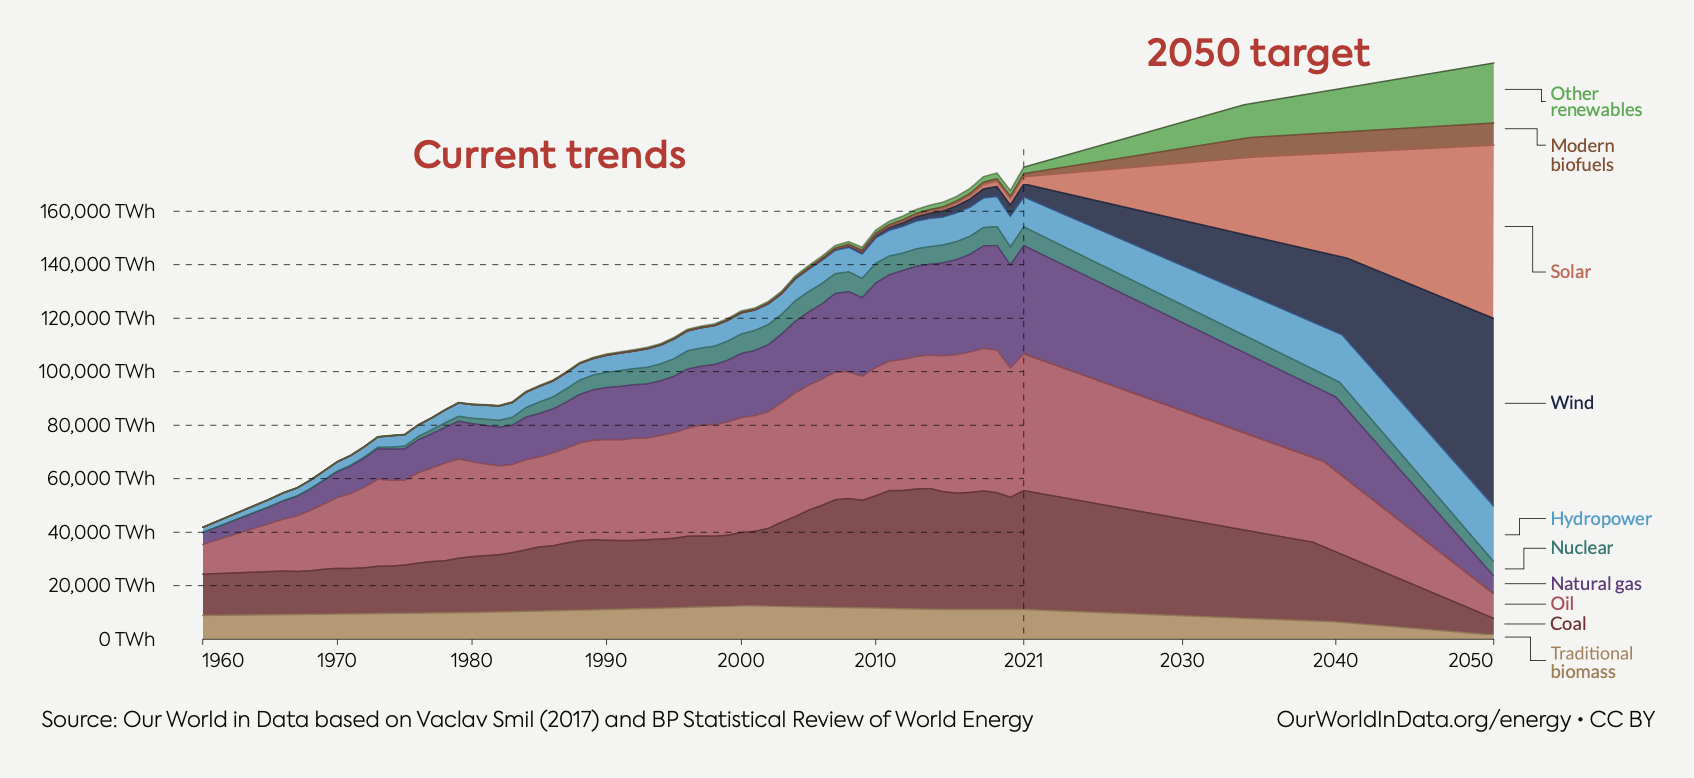
The transition in energy supply from fossil fuels to more sustainable sources is a gradual but essential process. While solar and wind energy are anticipated to fulfill a substantial portion of future energy demands, their inherent limitations, such as intermittency and dependency on weather conditions, render them insufficient to fully meet these demands.
Consequently, there is a pressing need for reliable baseload green electricity generation that can consistently provide power irrespective of external conditions.
Costs
Impact on Planet
awefull
- lots of carbon pollution
- takes out resources world doesn't have enough off
Details
Diesel Generator impact on Environment
Diesel electricity generation is considered bad for the environment for several reasons due to the negative impact it has on air quality, greenhouse gas emissions, and human health. Here are some key reasons why diesel-based electricity generation is harmful:
-
- Air Pollution: Diesel engines emit a variety of pollutants, including particulate matter (PM), nitrogen oxides (NOx), sulfur dioxide (SO2), and volatile organic compounds (VOCs). These pollutants can lead to poor air quality, smog formation, and respiratory problems in humans.
-
- Particulate Matter: Diesel engines emit fine particulate matter (PM2.5), which are tiny particles suspended in the air. These particles can penetrate deep into the lungs and even enter the bloodstream, causing a range of health issues, including respiratory diseases, cardiovascular problems, and premature death.
-
- Nitrogen Oxides (NOx): Diesel engines produce significant amounts of nitrogen oxides (NOx), which contribute to the formation of ground-level ozone and smog. NOx emissions can worsen respiratory conditions, irritate the respiratory system, and impair lung development in children.
-
- Greenhouse Gas Emissions: Diesel engines are fossil fuel-based and emit carbon dioxide (CO2) and other greenhouse gasses when burned. CO2 is a major contributor to global climate change and is a primary driver of the Earth's warming, leading to temperature rise, sea level rise, and extreme weather events.
-
- Black Carbon: Diesel engines emit black carbon, a type of particulate matter that contributes to air pollution and has a warming effect on the atmosphere. Black carbon settles on snow and ice, reducing their reflectivity (albedo) and accelerating melting.
-
- Environmental Damage: The extraction, production, and transport of diesel fuel contribute to environmental damage, including habitat destruction, water pollution, and ecosystem disruption. Oil spills during extraction and transport can harm aquatic and terrestrial ecosystems.
-
- Noise Pollution: Diesel generators are noisy and can contribute to noise pollution in both urban and rural areas. Noise pollution can have negative impacts on human health, including stress, sleep disturbances, and cardiovascular issues.
-
- Limited Renewable Energy Integration: Relying on diesel generators hinders the transition to cleaner and more sustainable energy sources like renewable energy (solar, wind, hydro) because it maintains dependency on fossil fuels.
To mitigate these environmental impacts, it's important to shift towards cleaner and more sustainable energy sources, such as renewable energy and grid-connected electricity. This transition not only helps reduce harmful emissions but also contributes to global efforts to combat climate change and improve air quality.
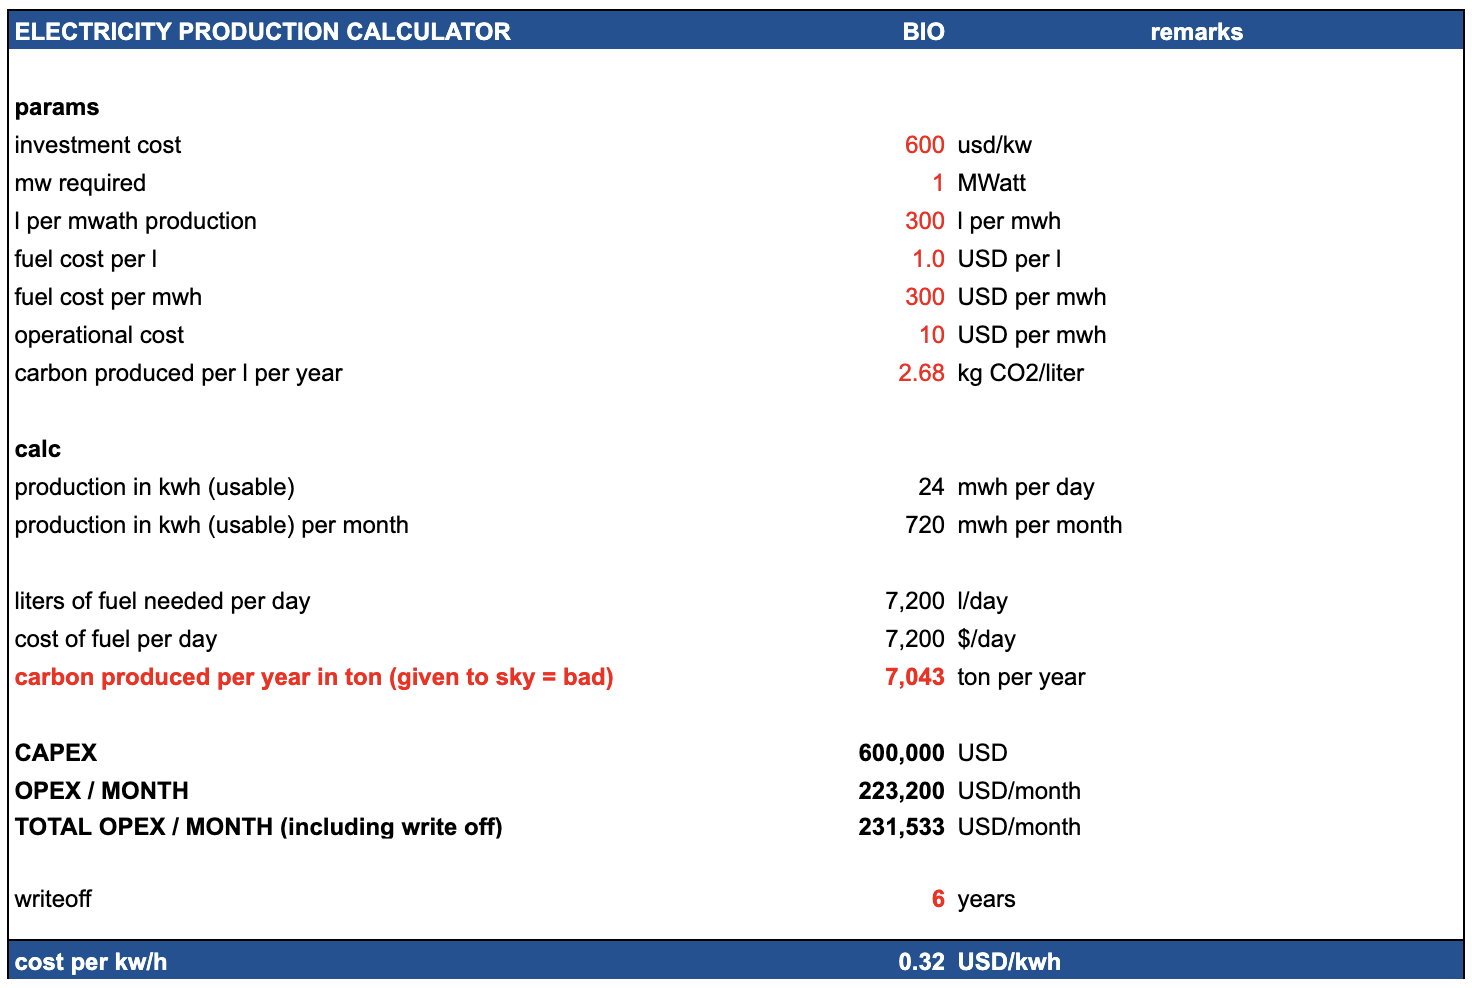
Diesel Generator Consumption
Here are some details on the typical fuel usage and consumption of a 1MW diesel generator
1MW = 1 mega watt
A diesel generator uses about 400 liters/hour for 1 MW of power output:
- Diesel generator power output: 1 MW
- Diesel consumption: 400 liters/hour
- Diesel cost: $1.5 per liter
To generate 1 MW for 1 hour requires:
- Power: 1 MW
- Time: 1 hour
- Therefore, diesel consumed is: 400 liters (given)
With diesel costing $1.5 per liter:
- Diesel consumed: 400 liters
- Diesel cost: $1.5 per liter
- Total fuel cost = 400 liters x $1.5 per liter = $600
So based on a diesel consumption of 400 liters/hour for a 1 MW generator, and a diesel cost of $1.5 per liter, the estimated fuel cost to generate 1 MW of electricity for 1 hour is $600.
do note that you need 1MW for e.g. 0.6MW usable electricity (the rest is lost to cooling and other overhead).
Daily utilization
Daily diesel consumption:
- Generator uses 400 liters/hr at 1 MW
- Running for 24 hours
- So total usage is: 400 liters/hr x 24 hrs = 9,600 liters per day
Daily fuel cost:
- Diesel consumed: 9,600 liters
- Diesel cost: $1.5 per liter
- Daily cost = 9,600 liters x $1.5 per liter = $14,400
10 MWatt Datacenter
We believe a datacenter needs to be at least 10 MWatt these days (AI).
If the datacenter would use Diesel this would result in a bill of 140,400 USD per day.
Electricity Cost Based on Fuel
Parameters
- Diesel fuel price: I used $1000 per metric ton, which is a representative global industrial price. Fuel prices vary by region.
- Density of diesel: 0.83 kg/L is the standard density. This converts volume in liters to mass in kg.
- Energy density: 36 MJ/L is the energy content per liter of diesel. This is an important factor.
- Generator efficiency: 40% is a typical efficiency of converting the diesel fuel energy to electrical energy. Good generators range from 38-42% conversion efficiency.
- Fuel consumption: 0.28 L/kWh is the estimated diesel consumption rate for the generator size. The generator datasheet provides this specification.
- Fuel energy input per kWh: By dividing the 0.28 L/kWh by the 0.83 kg/L density, we get the kg of diesel fuel input per kWh output. This shows the physical energy content.
- Fuel cost per kWh: Multiplying the kg/kWh by the fuel cost per kg ($1000 per ton divided by 1000 kg per ton) calculates the literal fuel cost to generate each kWh of electricity.
- O&M cost: Operation, maintenance and other costs add about 10% typically.
The result:
- Diesel fuel price: $1000 per metric ton
- Density of diesel: 0.83 kg/L
- Energy density: Approximately 36 MJ/L
- Generator efficiency: 40%
- Fuel consumption: 0.28 L/kWh generated
- Fuel energy input per kWh generated:
- 0.28 L / 0.83 kg/L = 0.34 kg per kWh
- Fuel cost per kWh:
- 0.34 kg x $1000 per ton / 1000 kg per ton = $0.34 per kWh
Total cost including operational cost ~$0.38 per kWh
Crude Oil Generation Plant
Here is an estimate of the capital cost for a 10MW electricity generation plant running on crude oil:
- For small-scale oil power plants, capital costs typically range from $1500-$2000 per kW of capacity.
- For a 10MW plant, the capacity-based costs would be:
- 10,000 kW x $1500 per kW = $15 million
- 10,000 kW x $2000 per kW = $20 million
- The crude oil boiler/combustor system likely costs around $2 million for 10MW scale.
- Turbines, generators and power system equipment adds $5-10 million.
- Balance of plant, construction, site development, permitting, engineering etc can cost $5-10 million.
- So the total capital cost would likely range from:
- $15 million + $10 million + $10 million = $35 million (on the lower end)
- $20 million + $10 million + $10 million = $40 million (on the higher end)
So in summary, the total installed capital cost for a 10MW crude oil power plant potentially ranges from $35 million to $40 million, with the per kW cost of the power generation equipment being the largest component. There are also significant ongoing fuel and O&M costs.
Crude Oil
Crude Oil is super bad for the environment
- Crude oil price: $90 per barrel
- 150 kg per barrel
- Energy density: 45 MJ/kg
- Power plant efficiency: 38%
- Oil required per kWh: 0.092 kg/kWh
- Fuel cost per kWh:
- 0.092 kg/kWh x $90 per barrel / 150 kg per barrel = $0.068
- O&M cost per kWh: $0.02
- Total cost per kWh:
- Fuel cost: $0.068
- O&M cost: $0.02
- Total: $0.088 per kWh
Conclusion: cost would be around $0.12 if we take into consideration price of plant.
Overview Cost
Impact on Planet
not bad but not ideal, still has carbon CO2 output (730 ton per year per mwatt)
- The production of 1 MW of solar panels is estimated to emit around 1,350 metric tons of CO2 (lots of energy production required).
- The production of 1 MWh of lithium battery production is estimated to emit around 175 metric tons of CO2.
- takes out resources world doesn't have enough off (lithium) !!!
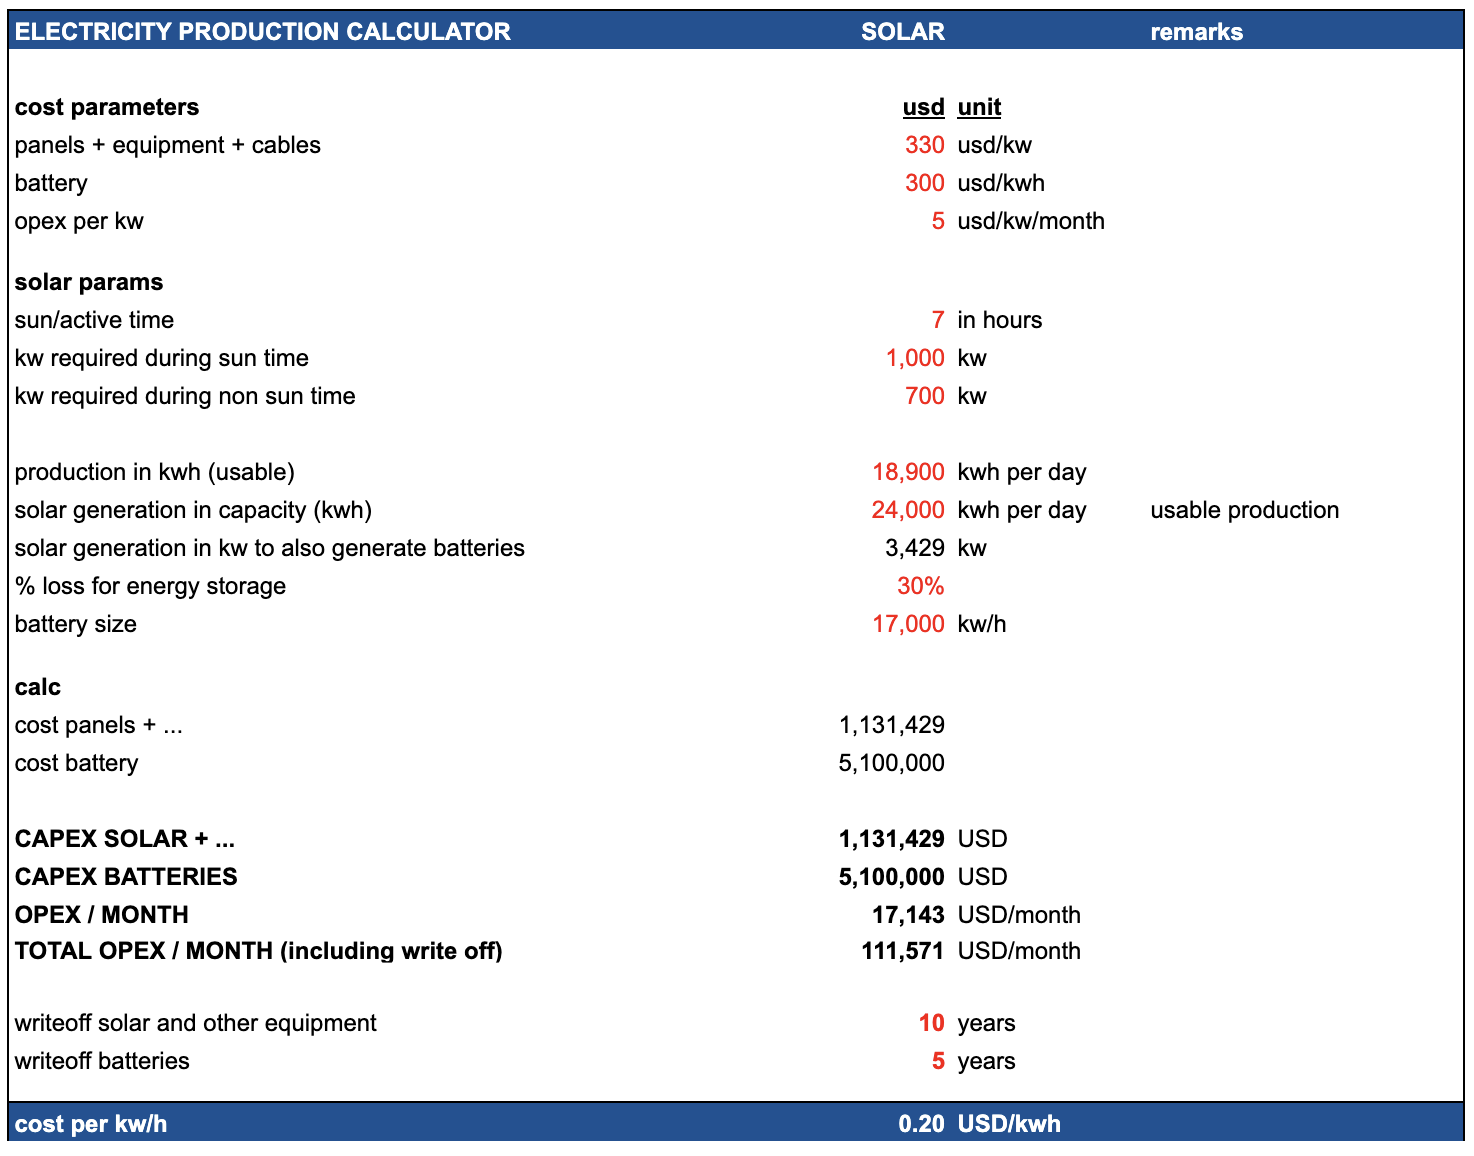
Cost for solar power plant
Here is an overview of the typical capital costs for a 1MW solar photovoltaic power plant:
- Solar modules - $0.5 - $0.6 million for crystalline silicon panels rated at 5W per sqft.
- Inverters - $50,000 - $100,000 for grid-tied inverter system and controls.
- Mounting system - $50,000 - $150,000 for fixed tilt or tracking mounts.
- Electrical equipment - $50,000 - $100,000 for transformers, switchgear, monitoring.
- Site preparation - $50,000 - $100,000 for grading, access, perimeter.
- Installation labor - $50,000 - $100,000 depending on complexity.
- Permitting and engineering - $50,000 - $100,000.
- Total: Approximately $800,000 to $1.2 million.
The wide range accounts for differences in site location, labor rates, type of PV panels, mounting system and other factors. Economies of scale provide some cost savings for larger utility-scale systems.
1MW solar PV power plant expressed in terms of cost per square meter:
- Solar modules - $100 - $120 per sqm. Crystalline silicon panels are typically rated at 200W per sqm.
- Inverters - $10 - $20 per sqm. Sized based on peak capacity.
- Mounting system - $10 - $30 per sqm. Depends on mounting type.
- Electrical equipment - $10 - $20 per sqm.
- Site preparation - $10 - $20 per sqm. Grading and access roads.
- Installation labor - $10 - $20 per sqm. Based on crew size.
- Permitting/engineering - $10 - $20 per sqm.
- Total: Approximately $160 to $250 per sqm.
The total PV system size for 1MW is typically 4000 - 5000 sqm depending on the solar irradiance availability.
Cost of electricity (LCOE) from a 1MW solar PV plant based on the capital costs per sqm:
Assumptions:
- Capital cost: $200 per sqm
- O&M cost: $10 per kW-year
- Solar irradiance: 1,800 kWh/sqm/year
- System lifetime: 25 years
- Discount rate: 7%
Calculations:
- System size for 1MW with 1,800 kWh/sqm/yr: 1,000 kW / 1,800 kWh/sqm/yr = ~555 sqm
- Capital cost = 555 sqm x $200 per sqm = $111,000
- O&M cost = 1,000 kW x $10 per kW-year = $10,000 per year
- Annual generation = 555 sqm x 1,800 kWh/sqm/yr = ~1,000,000 kWh
- LCOE = (Capital cost x CRF + O&M cost) / Annual generation
- Where CRF is capital recovery factor based on lifetime and discount rate
- LCOE = ($111,000 x 0.074 + $10,000) / 1,000,000 kWh = ~$0.085 per kWh
Ongoing O&M costs are relatively low for solar at around $10-$20k per MW capacity annually. No fuel costs obviously.
Cost for batteries
Here is a realistic estimate of the current costs for battery energy storage including capital and operational expenses:
- Lithium-ion batteries capital cost today ranges from $100/kWh to $300/kWh for grid-scale systems larger than 1MWh.
- A realistic mid-range capital cost is around $185/kWh.
- Fixed O&M costs are typically $10-$15/kW-year.
- Variable O&M costs around 0.5-1 cent/kWh cycled.
- Annual throughput of 250-500 cycles depending on usage.
- Battery lifespan is 5-15 years before replacement needed.
- So for a 10MWh system the costs over 10 years would be:
- Capital: 10,000 kWh x $185/kWh = $1.85 million
- Fixed O&M: $12.5/kW-year x 1000 kW = $125,000/year x 10 years = $1.25 million
- Variable O&M: Avg 400 cycles/year x 10 years x $0.0075/kWh = $300,000
- Total 10-year cost = $3.4 million
- Levelized cost around $340/MWh over 10 years for this system.
Actual costs vary widely based on battery chemistry, scale, location, ancillary equipment and project specifics. But this provides a realistic estimate for modeling purposes. Let me know if you need any other details!
Here are some of the lowest cost battery storage technologies for grid-scale electricity:
- Lithium-ion batteries - $100 - $250 per kWh for utility scale. Costs continue to decrease rapidly.
- Flow batteries - $120 - $200 per kWh fully installed. Lowest cost is vanadium redox at $150/kWh.
- Lead acid batteries - Around $100 per kWh. Only viable for shorter duration needs.
- Compressed air energy storage - $50 - $100 per kWh based on site geology. Requires underground caverns.
- Pumped hydro storage - $100 - $300 per kWh. Highly site dependent. Cheapest at scale.
- Hydrogen storage - $250 - $400 per kWh. Requires hydrogen production and fuel cells. Emerging option.
So in summary, lithium-ion batteries offer the lowest cost currently at around $100-$250/kWh at utility scale. Their costs have fallen fast and are expected to continue improving. For long duration storage, pumped hydro and compressed air can be most economical depending on site suitability.
Land needed
Here are some conservative estimates for the land area needed for a 5 MW solar PV facility in Africa:
- Assume a location in sub-Saharan Africa with an average solar insolation of 5.5 kWh/m2/day
- Use a conservative capacity factor of 15% for the solar PV system
- A solar panel with 20% efficiency and 1 m2 area will produce on average: 5.5 kWh/m2/day x 0.2 efficiency = 1.1 kWh per day 1.1 kWh/day x 365 days x 0.15 capacity factor = 61.2 kWh per year
- So each 1 m2 of solar panels will generate about 61.2 kWh per year
- The solar facility needs to generate 5 MW x 24 hours x 365 days = 43,800 MWh per year
- So total solar panels needed: 43,800,000 kWh / 61.2 kWh/m2 = 715,195 m2
- Add ~20% extra land for spacing, access roads etc.
- Total land area required: 715,195 m2 x 1.2 = 858,235 m2
- Which is 86 hectares or 0.86 km2
So for a 5 MW solar PV facility with a 15% capacity factor in sub-Saharan Africa, a conservative estimate is around 86 hectares or 0.86 km2 of land area.
If we only need it for 8 hours, then we can do ⅓
- We need 300,000m2 land for solar for the datacenter
Ultra Capacitors
Here are some key points about using ultracapacitors for large-scale energy storage:
- Ultracapacitors can store and discharge electricity very quickly, making them well-suited for short duration load leveling and frequency regulation applications.
- They have high power density (up to 10 kW/kg) but relatively low energy density (around 5-10 Wh/kg), so large banks would be needed for bulk energy storage.
- Ultracapacitors have high cycle life (>1 million cycles) and high round-trip efficiency (95%+) which is attractive.
- Cost is still relatively high compared to Li-ion batteries at around $200-300/kWh for the ultracapacitor system. Rapidly improving though.
- Large ultracapacitor banks connected to the grid often use a hybrid system configuration with batteries or other storage to optimize performance and costs.
- Ultracapacitors provide excellent complement to batteries by handling high power transients and smoothing fluctuations.
- Safety advantages over batteries with no fire/explosion risks. More environmentally friendly.
- Could potentially reduce the required size of substation equipment like transformers and switches.
- Challenges include developing pilots to demonstrate benefits, reducing costs further, integrating into grid infrastructure and energy markets.
So in summary, ultracapacitors have promising characteristics for large scale energy storage but may be better suited to specific high power applications rather than bulk energy storage due to cost and energy density limitations currently. Their role alongside batteries warrants further exploration.

Costs

Impact on Planet
great
- carbon sequestration (takes carbon out of sky)
- regenerates land
- energy cost of production is low
Details
Biomass needed
To generate 1 megawatt (MW) of electricity per hour from biomass requires approximately 1,000 kilograms (or 1 metric ton) of biomass fuel.
Here's a breakdown of the math:
- 1 MW of power = 1,000,000 watts
- With a typical biomass power plant electrical efficiency of around 25%, it takes 4 units of fuel energy to generate 1 unit of electrical energy.
- The energy content of biomass fuels varies by source, but a typical value is about 18 GJ per metric ton (at 10% moisture content).
- So to generate 1 MW of power for 1 hour requires:
1,000,000 W x 1 hr = 1,000,000 Wh = 3,600,000 kJ
At 25% efficiency, the fuel energy required is: 3,600,000 kJ / 0.25 = 14,400,000 kJ
With biomass containing 18 GJ/ton = 18,000 kJ/kg
The biomass fuel required is: 14,400,000 kJ / 18,000 kJ/kg = 800 kg, or approximately 1 metric ton.
So in summary, generating 1 MW of power from biomass for 1 hour requires burning approximately 1 ton of biomass fuel. The actual amount can vary slightly based on the biomass source and moisture content.
Land size needed for production of 1 MW
- 1 generate 1MW we need 1 ton per h -> 8,640 ton per year
- 1 ha produces 24 ton per year -> 360 ha
Cost to produce Hemp Biomass
see the production cost calculation doc, $100 per ton is probably achievable, and if we deduct income from carbon credits it can be $70
Cost per KWH
Here is the cost per kWh breakdown for a 1 MW biomass power plant:
Assumptions:
- 1 MW capacity
- 8,640 MWh annual generation
- $2,000,000 capital cost
- 10% interest rate on capital
Biomass Cost: $70/tonne (is biomass production - CO2 carbon credits)
- Annual biomass fuel cost: 8,640 tonnes x $70/tonne = $604,800
- Operational cost: $200,000
- Annual capital cost: $200,000
- Total annual cost = +-$1,000,000
- Cost per kWh = Total annual cost / Annual generation = $1,000,000 / 8,640 MWh = $0.11 per kWh
Other Biomass Sources
Here is an overview of some of the most cost-effective options for farming biomass to be used for electricity production:
- Short rotation woody crops like willow or poplar:
- Yield up to 8 dry tonnes/ha/year
- Require low inputs like fertilizer
- Cost around $50-60/dry tonne
- Perennial grasses like switchgrass or miscanthus:
- Yield up to 20 dry tonnes/ha/year
- Low input costs, well-suited to marginal land
- Cost around $40-60/dry tonne
- Agricultural residues like straw and corn stover:
- Already produced as byproducts of food crops
- Cost just $20-40/dry tonne
- Lower yields than dedicated energy crops
- Fast growing trees like eucalyptus:
- Yield 10-40 dry tonnes/ha/year depending on climate
- Cost around $40-50/dry tonne
- Hemp:
- Yields around 8 dry tonnes/ha/year
- Low input costs
- Cost around $100-150/dry tonne
The lowest cost options are agricultural residues, but availability may be limited. Perennial grasses like switchgrass provide a good combination of high yields and low costs.
Overall, the optimal feedstock depends on local climate, land availability, and production costs. But several options can provide biomass at costs competitive with other fuel sources.
CO2 Absorption
Here are some estimates on how much CO2 can be absorbed per hectare of industrial hemp production per growing season:
- Hemp plants absorb CO2 through photosynthesis during their rapid growth stage.
- Reported figures indicate hemp can absorb 4-15 tons of CO2 per hectare per growing season.
- The wide range depends on specific cultivar, planting density, climate and cultivation practices.
- The bulk of CO2 absorption occurs during the vegetative stage before flowering/seed setting.
- Hemp grown for fiber may absorb more than that grown for CBD oil production.
- The fast growing nature of industrial hemp makes it an effective carbon sink compared to other crops and vegetation.
In summary, published studies indicate industrial hemp can potentially absorb 6-15 tons of CO2 per hectare over a single growing season, making it a promising carbon sequestration crop.
lets use 12 for this calculation, which means 36 ton per year.
value of carbon credit
The price of a carbon credit, which typically represents one metric ton of CO2 emissions reduced or removed from the atmosphere, varies considerably based on several factors. These factors include the carbon offset market (voluntary or compliance), the project type generating the credits, the location, and additional environmental or social benefits associated with the project.
-
Voluntary Carbon Markets: In voluntary markets, where entities buy carbon credits to offset their emissions beyond regulatory requirements, prices can range widely. In 2022, average prices ranged from around $3 to over $50 per ton of CO2, depending on the quality and co-benefits of the offsets. High-quality projects with strong environmental integrity and additional social benefits tend to command higher prices.
-
Compliance Carbon Markets: In compliance markets, which are part of regulatory schemes like the European Union Emissions Trading Scheme (EU ETS), prices are typically higher. For instance, prices in the EU ETS have been observed to be in the range of €50 to €90 per ton of CO2 (equivalent to approximately $60 to $100, depending on exchange rates).
The carbon credit market is dynamic, and prices fluctuate based on supply and demand, regulatory changes, and global climate policy developments. Additionally, the method of carbon sequestration or emission reduction, the verification process, and the longevity and permanence of the carbon reduction all play significant roles in determining the value of a carbon credit.
lets use $20 per ton of CO2
Conclusion
1 hectare of land can produce 24 ton of biomass which costs about 2400 USD, and produces $20 x 36 of carbon credits = 720 USD, this means 1 ton would cost about $70 per ton rather than $100.
biomass production cost
-
Land Preparation: This includes plowing, harrowing, and possibly adding amendments to the soil. Costs can vary widely but let's assume a cost of $200 per hectare.
-
Labor: This is highly variable based on local wage rates and the intensity of labor required. For this estimate, assume $300 per hectare for the entire growing cycle.
-
Irrigation: Costs depend on local water availability and infrastructure. Assume an average cost of $200 per hectare. Locations need to be chosen where there is good water.
-
Fertilizer and Pest Control: This includes the cost of organic fertilizer and pest control methods. Estimate around $200 per hectare. For hemp its not so much.
-
Harvesting and transport: The cost can vary based on whether it's done manually or with machinery. Assume a cost of $300 per hectare.
-
Lease of land: Allocate about $200 per year, we can harvest 3x per year, let's go for $100.
Adding these up gives a total estimated cost:
- Total Estimated Cost per Hectare: $1,300
Please note, these are very rough estimates and actual costs can differ greatly based on specific circumstances. For a more accurate assessment, local agricultural costs and practices should be thoroughly researched.
production per year
To estimate the biomass yield of industrial hemp (focusing solely on the biomass for fiber and excluding seeds or CBD), we can use the average yields for fiber hemp. The biomass in this context refers to the stalks of the hemp plant, which are processed for fiber.
Fiber hemp yields can range from 6 to 12 tons per hectare per harvest. Using the median value of 8 tons per hectare per harvest and considering the possibility of three harvests per year, the calculation for annual biomass yield per hectare would be as follows:
- Yield per Harvest: 8 tons of biomass (fiber hemp)
- Harvests per Year: 3
- Annual Biomass Yield per Hectare: 8 tons/harvest × 3 harvests/year = 24 tons per hectare/year
Therefore, under good conditions, you might produce approximately 24 tons of hemp biomass per hectare annually with three harvests. However, it's crucial to remember that achieving three harvests per year is ambitious and highly dependent on regional climatic conditions, the hemp variety chosen, and effective farming practices.
Conclusion
To calculate the cost per ton of hemp based on a cost of $1,300 per harvest cycle, let's recap the key figures:
- Cost per Harvest Cycle: $1,300 per hectare
- Biomass Yield per Harvest: an average yield of 8 tons per hectare per harvest.
- Harvests per Year: 3
First, we calculate the annual cost and then determine the cost per ton:
Annual Cost:
- Cost per Harvest Cycle: $1,300
- Harvests per Year: 3
- Annual Cost: $1,300/harvest × 3 harvests = $3,900 per hectare per year
Annual Biomass Yield:
- Yield per Harvest: 8 tons
- Harvests per Year: 3
- Annual Biomass Yield: 8 tons/harvest × 3 harvests = 24 tons per hectare per year
Cost per Ton of Hemp:
- Annual Cost: $3,900 per hectare
- Annual Yield: 24 tons per hectare
- Cost per Ton: $3,900 / 24 tons = $162.50 per ton
Therefore, based on these estimates, the cost to produce one ton of hemp biomass would be approximately $162.50.
Remember, this calculation is an estimate and actual costs can vary based on factors such as local labor and input costs, climatic conditions, and farming practices.
This is probably at the high side for east africa, lets use $100 per ton.
![]()
Overview Cost
![]()
Impact on Planet
not so bad actually
- if managed well nuclear might be a clean source of energy, especially generation 4
Details
The cost of building and operating a nuclear power plant varies significantly depending on numerous factors, including location, technology used, regulatory environment, and local labor and material costs. As of my last update in April 2023, here are some general estimates:
1. Capital Costs (Construction)
The capital cost of a nuclear power plant includes expenses for planning, licensing, site preparation, construction, and commissioning. These costs are highly variable but can be broadly estimated:
- Western Nations: In the United States and Europe, the capital costs for new nuclear plants can be very high, often ranging from $6,000 to over $9,000 per kilowatt (kW). This translates to $6 - $9 million per megawatt (MW).
- Asia: In countries like South Korea and China, costs are generally lower, often in the range of $2,000 to $4,000 per kW, or $2 - $4 million per MW.
2. Operational Costs
Operational costs include fuel, maintenance, and staffing. These costs can vary, but a general estimate is:
- Fuel Costs: Typically range from $5 to $10 per MWh.
- Operation and Maintenance (O&M): These costs are variable but can range from $20 to $40 per MWh in the U.S. and similar markets. In some Asian markets, these costs might be lower.
3. Total Cost of Electricity
The total cost of electricity from a nuclear plant includes capital, fuel, and operational costs, spread over the plant's lifetime and its electricity output. This can typically range from:
- $40 to $120 per MWh (or 4 to 12 cents per kWh):
Considerations
-
Decommissioning Costs: Eventually, a nuclear plant must be decommissioned, which can be a significant expense, but this cost is often accounted for over the plant's operational lifetime.
-
Loan Interest: The capital cost calculation often includes the interest during construction, significantly impacting the overall cost.
-
Time Overruns: Delays in construction can significantly increase the total cost.
-
Waste Disposal: The cost of nuclear waste management is another factor, though it's generally a small percentage of the total cost.
-
New Technologies: Advanced nuclear reactors, like Small Modular Reactors (SMRs), might offer lower costs and shorter construction times in the future.
These figures provide a general framework, but actual costs can vary significantly based on the specific project and region.
Cost to generate H20
Here is an estimate of the cost to generate 1 liter of H2O (water) from electricity:
- The chemical reaction for water electrolysis is:
2H2O --> 2H2 + O2 - This requires an input of 286 kJ of electricity per mole of water.
- One mole of water = 18 grams = 18 mL of water
- So to generate 1 liter of water (1000 mL) requires:
1000 mL / 18 mL per mole = 55.6 moles - Electricity input required = 55.6 moles x 286 kJ per mole = 15,930 kJ
- 15,930 kJ = 4.42 kWh of electricity
- At an electricity price of $0.10 per kWh:
Cost for 4.42 kWh = $0.44
So the estimated cost to produce 1 liter of H2O from water electrolysis powered by electricity is around $0.44, assuming an electricity rate of $0.10 per kWh.
This does not include the capital cost of the electrolyzer system. But in terms of just operating costs, the electricity required to split water into hydrogen and oxygen to generate 1 liter of H2O would be around $0.44 at current typical electricity prices.
to generate 1 liter of H2O from electricity via water electrolysis at an electricity rate of $0.15 per kWh:
- The electricity input required to generate 1 liter of H2O is 4.42 kWh, based on the previous calculation.
- At a cost of $0.15 per kWh:
- Cost for 4.42 kWh at $0.15/kWh = 4.42 * $0.15 = $0.66
So with an electricity price of $0.15 per kWh, the estimated cost to produce 1 liter of H2O through electrolysis would be $0.66.
H20 Cost
For a large commercial electrolyzer:
- Capacity: 500 liters H2O/hour
- System cost around $400,000-$600,000
- Utilizing proton-exchange membrane (PEM) electrolysis cells
- Cell stack cost around $600 per kW
- 500 liters/hr requires around 60 kW
- Cell stack cost = 60 kW x $600 per kW = $36,000
- Balance of system adds ~2X cost
- Total system cost ~$400,000
Here is the cost estimate re-done for $0.15/kWh electricity and formatted more clearly:
Assumptions:
- Electrolyzer efficiency: 70%
- Electricity cost: $0.15/kWh
- $400,000 electrolyzer capital cost
- 10 year amortization
- 5% interest
- 50% capacity factor
To store 1 MWh electricity as H2O:
- Electricity required: 1 MWh / 0.70 efficiency = 1.43 MWh
- Electricity cost (@ $0.15/kWh): 1.43 MWh x $0.15/kWh = $214.50
- H2O generated: 1.43 MWh x 278 g/MJ x 3600 MJ/MWh = 1,429 kg
- Annual amortized capital cost: $48,763
- Annual H2O production: 6,186 tonnes
- Capital cost per tonne H2O: $48,763 / 6,186 tonnes = $7.88
- Capital cost for 1.429 tonnes H2O: 1.429 tonnes x $7.88/tonne = $11.28
Total cost to store 1 MWh in H2O:
Electricity: $214.50 Capital: $11.28 Total: $225.78

Costs
A high-power, dependable datacenter constructed using traditional designs can incur a substantial cost of over $15 million per megawatt.
Consider a scenario where the design targets a modest 50 kW per rack for future-proofing, and we plan for 200 racks. Such a setup would require a 10-megawatt power capacity. The financial implication of this is significant – constructing a datacenter of merely 500 square meters under these parameters would entail an investment of around $150 million.
Operating a 10-megawatt load using a diesel generator would translate to a daily expense of approximately $140,400. When projected over a year, the power costs alone would escalate to an unsustainable $51 million, casting serious doubts on the economic feasibility of such an operation.
Details

Datacenter Cost
The cost to build a data center can vary widely based on numerous factors, including location, design specifications, infrastructure quality, and the intended power capacity per rack.
Factors Influencing Data Center Construction Costs:
-
Power Capacity and Redundancy: Higher power per rack generally means more robust electrical infrastructure, including transformers, generators, uninterruptible power supplies (UPS), and distribution units. Redundancy levels (N+1, 2N, etc.) also impact cost.
-
Cooling Systems: As power per rack increases, so does the need for efficient cooling. Advanced cooling systems (like in-row cooling, liquid cooling, or chilled beam systems) can significantly increase costs.
-
Land and Construction: The location and the local price of construction play a significant role. Urban areas typically have higher costs compared to rural areas.
-
Building Specifications: The cost is influenced by whether you are retrofitting an existing building or constructing a new one, including the need for raised floors, structural reinforcements, and security measures.
-
Network Infrastructure: High-quality cabling, switches, and routers are essential, especially for higher-density setups.
-
Energy Efficiency Measures: Investments in energy-efficient design and equipment (like energy-efficient UPS systems, solar panels, or advanced building management systems) can increase initial costs but often reduce operational costs in the long term.
Rough Cost Estimates:
-
Low-Density Setup (1-5 kW per rack): For a traditional data center with lower power densities, construction costs might range from $7 to $12 million per MW of IT load.
-
Medium-Density Setup (5-10 kW per rack): This requires more robust infrastructure and might cost between $10 to $15 million per MW of IT load.
-
High-Density Setup (10-20+ kW per rack): For high-density environments, especially those needing advanced cooling solutions, the cost can exceed $15 million per MW of IT load.
Additional Considerations:
- Economies of Scale: Larger data centers often enjoy lower costs per MW due to economies of scale.
- Operational Costs: Operational expenses, including energy, maintenance, and staffing, can significantly impact the total cost of ownership.
- Customization and Future-Proofing: Costs increase if the data center is designed for specific needs or built with the capability to easily upgrade and expand in the future.
Given these variables, it's essential for an organization to thoroughly analyze its specific requirements and future growth expectations when planning a data center. Consulting with architects and engineers who specialize in data center construction can provide more precise cost estimates based on current market conditions and specific requirements.

AI Ready
Self healing, AI ready datacenters might be smaller in size but they are so much more powerefull.
These datacenters are
- more secure
- more cost effective
- more green
- more easy to use
- more ready for the future
TO BE DONE
A “cyber pandemic" is a reality

Much like the world has grappled with virus-based pandemics, the threat of a cyber pandemic is arguably even more perilous and poses a direct threat to life and security.
We are of the opinion that several major nations are either in the process of establishing or have already established their dominance in the digital realm. In a manner akin to a cyber pandemic, it's conceivable to develop digital "viruses" that can effectively accomplish their intended objectives.
Numerous examples substantiate our concerns, though we've highlighted only a few here. According to experts in the field, it's almost a certainty that a vast array of systems are compromised, embedded with pre-existing vulnerabilities.
This situation bears a striking resemblance to what might occur in the event of a virus-based pandemic, akin to premeditated biological warfare. The aftermath of deploying such an attack could be catastrophic, potentially leading to a genuine pandemic. Some might erroneously believe they can control such a situation, but in our view, this represents a direct path to the potential destruction of human civilization.
The threat of a cyber pandemic is similar and is arguably already in place, albeit not yet unleashed in its full capacity. The backdoors and vulnerabilities exist; it's only a question of time and resources before they are exploited on a larger scale.
For those seeking evidence, consider this: for less than $50,000 a year, one can gain access to an individual's complete digital life and footprint, including travel details, personal information, data, and financial transactions. High-profile individuals, like presidents, understandably have a higher price tag for such invasive access.
Africa is a target.

Africa is immensely endowed with natural resources, ranging from agricultural bounty to water, minerals, and gold. However, it appears that certain major global powers are engaged in efforts to destabilize the continent, seemingly to facilitate even greater resource extraction.
Take Tanzania as an example: despite being among the richest countries globally in terms of natural resources, it has one of the lowest GDP per capita figures. This discrepancy raises the question: is Tanzania being exploited?
Fortunately, Tanzania benefits from a stable government, characterized by strong leadership, a clear vision, and a commitment to national improvement. Regrettably, not all African countries are in a similar position.
From our perspective, there are three primary mechanisms enabling this exploitation:
- Investment Deals Leading to Debt: Such arrangements often empower external entities at the expense of the host country's autonomy.
- Mass-Scale Internet Information Manipulation: This is particularly evident in situations involving country takeovers or coups d'état.
- Corruption and Greed: This combination results in inequitable agreements that disadvantage the affected countries.
Currently, we are witnessing significant geo-political maneuvers. The world's major powers seem to be carving up Africa among themselves, each vying to secure resources for their future needs.
- https://www.bbc.com/news/world-africa-46783600
- https://www.usip.org/publications/2022/02/sixth-coup-africa-west-needs-its-game
- https://media.africaportal.org/documents/KAIPTC-Policy-Brief-3---Coups-detat-in-Africa.pdf
We are of the view that manipulation of information, encompassing aspects like cyber warfare and psychological information tactics, is not only a critical component but also the most straightforward method to facilitate such geopolitical maneuvers.
There is a 3rd world war, it's a war on data and digital infrastructure.

Data is the new gold of the digital universe, few global countries and some corporations have absolute dominance from this perspective.
In state of conflict first thing happening are actions to destabilize critical digital infrastructure:
- Ukraine, Russia took out 5 datacenters as first targets to destabilize the country and destroy important data for the country (e.g. birth certificates are now gone, land ownership...).
- Ukraine gets lots of denial of service attacks (only one of sources, other one).
- There are many other signs where cyber attacks are used to influence people or take over infrastructure.
- Countries are not prepared for these situations, example here.
- Intelligence Organizations, do harvest info, there are tons of links but some to start: link1.
Only very few countries in the world have enough resources to play in this 3rd digital world war, the other countries are completely unprotected and at the mercy of others.
Most of the IT (network) equipment bought comes from one of the big players and much of it is vulnerable by design.
Your current internet infrastructure is super vulnerable
The Internet became very centralized, a denial of service attack can bring down full countries very fast.
90% of services used by citizens or governments rely on internet services out of the country, the moment some of the internet lines or crucial internet services like DNS (name services) are taken down is enough to take down the internet.
It's surprising to see how vulnerable the internet became and how few people actually understand this risk.
Possible ways how to bring internet down (these are only a few methods, there are many more):
- Often enough to cut 1 internet or large land cable, this will cause overloads on other internet lines, because of how the internet protocol (TCP) works, it would become unusable for +- all services.
- Do a denial of service attack on name servers in the country or outside, this means names would not be resolved to internet addresses, which means no service.
- Spoof routing protocols, make noise of routing updates, basically make the internet crazy and get it to think about routes which are slow or don’t exist.
- Do a denial of service attack on internet backbone services of a country, all will stop.
- Use some pre-hacked routers, to reroute traffic, again all would stop.
Some Interesting Facts
- +30% of internet traffic goes over Egypt, if that one would go down the internet might have very serious issues to continue normal operations.
- 99% if internet traffic does not stay in country in most emerging countries, leading to more cost and information and money loss
Information is manipulated to organize state destabilizing actions
Information & public opinion became one of the most valuable commodities in the world, companies are selling their soul for it, large governments are spending many billions of dollars to get access to the information and data in a structured way and prepare themselves for this 3rd world war.
3 large countries with their direct allies have absolute dominance from this perspective, lots of games are being played in between, just like it would be in a real war with spies and double spies.
There are now tens of very concrete examples where governments were taken over because of mass manipulation.
A very concrete example was in Egypt, the revolution some years ago would not have been possible without manipulation of the (social) media. Lucky for Egypt, some groups of people managed to re-organize and undo some of the damage done and the 2e revolution happened, but it shows how dangerous it can be. This is like the box of Pandora, it's very dangerous to execute on and even more difficult to protect against.
Information Manipulation

Manipulation of data leads to huge side effects even going as far as manipulating election results and even genocide in some cases.
It's becoming extremely difficult to distinguish between truth and untruths, one of the issues which need to be addressed is the role of anonymity and reputation. A new internet paradigm is needed.
See:
https://www.diplomatie.gouv.fr/img/pdf/
information_manipulation_rvb_cle838736.pdf
Some links to demonstrate:
- https://freedomhouse.org/report/freedom-net/2017/manipulating-social-media-undermine-democracy
- https://www.ox.ac.uk/news/2021-01-13-social-media-manipulation-political-actors-industrial-scale-problem-oxford-report
- https://en.wikipedia.org/wiki/Internet_manipulation
- https://en.wikipedia.org/wiki/State-sponsored_Internet_propaganda
- https://en.wikipedia.org/wiki/Russian_interference_in_the_2016_United_States_elections
- https://africacenter.org/spotlight/strategic-implications-for-africa-from-russias-invasion-in-ukraine/
Cyber manipulation and cyber attacks are the most efficient way to destabilize full countries and take over power.
Countries like China and Russia have been preparing for this for many years now so they can cut their internet from the global one which we believe is NOT THE RIGHT SOLUTION, this undo’s one of the most important happenings in the world during the last 100 years. The internet brought global access to information and collaboration possibilities. Going back to 100 separate internets would be a very bad move. But we might wonder, why do large powerful countries like this feel the need to be able to cut and separate/control their internet?

Technology
Building a datacenter is so much more than real estate and power, we believe next gen datacenters need to deliver the raw compute, storage, network and AI capacity as is required by the IT users.
The following technology is all opensource and available to all.
this section needs to be completed
i
Quantum Safe Storage System
Our storage architecture follows the true peer2peer design of the TF grid. Any participating node only stores small incomplete parts of objects (files, photos, movies, databases...) by offering a slice of the present (local) storage devices. Managing the storage and retrieval of all of these distributed fragments is done by a software that creates development or end-user interfaces for this storage algorithm. We call this 'dispersed storage'.

Peer2peer provides the unique proposition of selecting storage providers that match your application and service of business criteria. For example, you might be looking to store data for your application in a certain geographic area (for governance and compliance) reasons. You might also want to use different "storage policies" for different types of data. Examples are live versus archived data. All of these uses cases are possible with this storage architecture, and could be built by using the same building blocks produced by farmers and consumed by developers or end-users.
More Information
Quantum Safe Storage Algoritm

The Quantum Safe Storage Algorithm is the heart of the Storage engine. The storage engine takes the original data objects and creates data part descriptions that it stores over many virtual storage devices (ZDB/s)
Data gets stored over multiple ZDB's in such a way that data can never be lost.
Unique features
- data always append, can never be lost
- even a quantum computer cannot decrypt the data
- is spread over multiple sites, sites can be lost, data will still be available
- protects for datarot.
Why
Today we produce more data than ever before. We could not continue to make full copies of data to make sure it is stored reliably. This will simply not scale. We need to move from securing the whole dataset to securing all the objects that make up a dataset.
ThreeFold is using space technology to store data (fragments) over multiple devices (physical storage devices in 3Nodes). The solution does not distribute and store parts of an object (file, photo, movie...) but describes the part of an object. This could be visualized by thinking of it as equations.
Details
Let a,b,c,d.... be the parts of that original object. You could create endless unique equations using these parts. A simple example: let's assume we have 3 parts of original objects that have the following values:
a=1
b=2
c=3
(and for reference the part of real-world objects is not a simple number like '1' but a unique digital number describing the part, like the binary code for it '110101011101011101010111101110111100001010101111011.....'). With these numbers we could create endless amounts of equations:
1: a+b+c=6
2: c-b-a=0
3: b-c+a=0
4: 2b+a-c=2
5: 5c-b-a=12
......
Mathematically we only need 3 to describe the content (=value) of the fragments. But creating more adds reliability. Now store those equations distributed (one equation per physical storage device) and forget the original object. So we no longer have access to the values of a, b, c and see, and we just remember the locations of all the equations created with the original data fragments. Mathematically we need three equations (any 3 of the total) to recover the original values for a, b or c. So do a request to retrieve 3 of the many equations and the first 3 to arrive are good enough to recalculate the original values. Three randomly retrieved equations are:
5c-b-a=12
b-c+a=0
2b+a-c=2
And this is a mathematical system we could solve:
- First: 'b-c+a=0 -> b=c-a'
- Second: '2b+a-c=2 -> c=2b+a-2 -> c=2(c-a)+a-2 -> c=2c-2a+a-2 -> c=a+2'
- Third: '5c-b-a=12 -> 5(a+2)-(c-a)-a=12 -> 5a+10-(a+2)+a-a=12 -> 5a-a-2=2 -> 4a=4 -> a=1'
Now that we know 'a=1' we could solve the rest 'c=a+2=3' and 'b=c-a=2'. And we have from 3 random equations regenerated the original fragments and could now recreate the original object.
The redundancy and reliability in such system comes in the form of creating (more than needed) equations and storing them. As shown these equations in any random order could recreate the original fragments and therefore redundancy comes in at a much lower overhead.
Example of 16/4

Each object is fragmented into 16 parts. So we have 16 original fragments for which we need 16 equations to mathematically describe them. Now let's make 20 equations and store them dispersedly on 20 devices. To recreate the original object we only need 16 equations, the first 16 that we find and collect which allows us to recover the fragment and in the end the original object. We could lose any 4 of those original 20 equations.
The likelihood of losing 4 independent, dispersed storage devices at the same time is very low. Since we have continuous monitoring of all of the stored equations, we could create additional equations immediately when one of them is missing, making it an auto-regeneration of lost data and a self-repairing storage system. The overhead in this example is 4 out of 20 which is a mere 20% instead of (up to) 400%.
Content distribution Policy (10/50)
This system can be used as backend for content delivery networks.
Imagine a movie being stored on 60 locations from which we can loose 50 at the same time.
If someone now wants to download the data, the first 10 locations who answer fastest will provide enough of the data parts to allow the data to be rebuild.
The overhead here is much more, compared to previous example, but stil order of magnitude lower compared to other cdn systems.
Datarot
Datarot cannot happen on this storage system.
Fact that data storage degrades over time and becomes unreadable, on e.g. a harddisk. The storage system provided by ThreeFold intercepts this silent data corruption, making that it can pass by unnotified.
see also https://en.wikipedia.org/wiki/Data_degradation
Zero Knowledge Proof
The quantum save storage system is zero knowledge proof compliant. The storage system is made up / split into 2 components: the actual storage devices use to store the data (ZDB's) and the Quantum Safe Storage engine.

The zero proof knowledge compliancy comes from the fact that all the physical storage nodes (3nodes) can proof that they store a valid part of what data the quantum safe storage engine (QSSE) has stored on multiple independent devices. The QSSE can validate that all the QSSE storage devices have a valid part of the original information. The storage devices however have no idea what the original stored data is as they only have a part (description) of the origina data, and have no access to the original data part or the complete origal data objects.
i
Quantum Safe Filesystem
A redundant filesystem, can store PB's (millions of gigabytes) of information.
Unique features:
- Unlimited scalable (many petabytes) filesystem
- Quantum Safe:
- On the TFGrid, no farmer knows what the data is about
- Even a quantum computer cannot decrypt
- Data can't be lost
- Protection for datarot, data will autorepair
- Data is kept for ever (data does not get deleted)
- Data is dispersed over multiple sites
- Sites can go down, data not lost
- Up to 10x more efficient than storing on classic storage cloud systems
- Can be mounted as filesystem on any OS or any deployment system (OSX, Linux, Windows, Docker, Kubernetes, TFGrid, ...)
- Compatible with ± all data workloads (not high performance data driven workloads like a database)
- Self-healing: when a node or disk is lost, the storage system can get back to the original redundancy level
- Helps with compliance to regulations like GDPR (as the hosting facility has no view on what is stored, information is encrypted and incomplete)
- Hybrid: can be installed onsite, public, private, ...
- Read-write caching on encoding node (the front end)

Mount Any Files in your Storage Infrastructure
The QSFS is a mechanism to mount any file system (in any format) on the grid, in a quantum-secure way.
This storage layer relies on 3 primitives of the ThreeFold technology :
-
0-db is the storage engine. It is an always append database, which stores objects in an immutable format. It allows keeping the history out-of-the-box, good performance on disk, low overhead, easy data structure and easy backup (linear copy and immutable files).
-
0-stor-v2 is used to disperse the data into chunks by performing 'forward-looking error-correcting code' (FLECC) on it and send the fragments to safe locations. It takes files in any format as input, encrypts the file with AES based on a user-defined key, then FLECC-encodes the file and spreads out the result to multiple 0-DBs. The number of generated chunks is configurable to make it more or less robust against data loss through unavailable fragments. Even if some 0-DBs are unreachable, you can still retrieve the original data, and missing 0-DBs can even be rebuilt to have full consistency. It's an essential element of the operational backup.
-
0-db-fs is the filesystem driver which uses 0-DB as a primary storage engine. It manages the storage of directories and metadata in a dedicated namespace and file payloads in another dedicated namespace.
Together they form a storage layer that is quantum secure: even the most powerful computer can't hack the system because no single node contains all of the information needed to reconstruct the data.

This concept scales forever, and you can bring any file system on top of it:
- S3 storage
- any backup system
- an ftp-server
- IPFS and Hypercore distributed file sharing protocols
- ...

Architecture
By using our filesystem inside a Virtual Machine or Kubernetes, the TFGrid user can deploy any storage application on top e.g. AI, Minio for S3 storage, OwnCloud as online fileserver.
Any storage workload can be deployed on top of the Quantum Safe Storage System.
graph TD
subgraph Data Ingress and Egress
qss[Quantum Safe Storage Engine]
end
subgraph Physical Data storage
st1[In Liquid Storage Device 1]
st2[In Liquid  Storage Device 2]
st3[In Liquid  Storage Device 3]
st4[In Liquid  Storage Device 4]
st5[In Liquid  Storage Device 5]
st6[...]
qss -.-> st1 & st2 & st3 & st4 & st5 & st6
end
Zero Knowledge Proof Storage system.
The quantum save storage system is zero knowledge proof compliant. The storage system is made up / split into 2 components: The actual storage devices use to store the data (ZDB's) and the Quantum Safe Storage engine.
The zero proof knowledge compliancy comes from the fact the all the physical storage nodes (3nodes) can proof that they store a valid part of what data the quantum safe storage engine (QSSE) has stored on multiple independent devices. The QSSE can validate that all the QSSE storage devices have a valid part of the original information. The storage devices however have no idea what the original stored data is as they only have a part (description) of the origina data and have no access to the original data part or the complete origal data objects.
Additional pages
A normal user can ignore these pages, they are for the authors to see e.g. errors
Errors
Be the mother for our errors.
Errors
Be the mother for our errors.
Errors
page_not_found
page not found: cyberpandemic:list.md
page_not_found
page not found: cyberpandemic:48.md
Errors
image_not_found
image not found: datacenter:planet_fs.jpg
image_not_found
image not found: datacenter:quantum_safe_storage.jpg
image_not_found
image not found: datacenter:quantum_safe_storage_scale.jpg
page_not_found
page not found: datacenter:technology_layers.md
page_not_found
page not found: datacenter:s3_interface.md
Errors
image_not_found
image not found: datacenter_biz:solar.png
image_not_found
image not found: datacenter_biz:tiers_why_for_country.png
image_not_found
image not found: datacenter_biz:benefits_investors_tiers.png
Errors
page_double
Can't add /Users/despiegk1/code/git.ourworld.tf/ourworld_holding/info_ourworld/collections/electricity/research/tosort/electricity.md: a page named electricity already exists in the collection
page_not_found
page not found: electricity:intro.md
Additional pages
A normal user can ignore these pages, they are just to get links to work.
Renewables: Cheapest form of power
https://www.un.org/en/climatechange/renewables-cheapest-form-power
The cheapest sources of electricity generation are:
- Geothermal - Using natural steam or hot water from underground reservoirs has very low fuel costs, making geothermal one of the cheapest electricity sources. However, it requires specific geology so is limited in locations. The LCOE (levelized cost of electricity) ranges from $20-50 per MWh.
- Hydroelectric - After a dam is built, the fuel (flowing water) is free. Operation and maintenance costs are low compared to other technologies. Hydro LCOE can be as cheap as $20-40 per MWh at good sites.
- Wind - Once installed, the fuel (wind) is free and maintenance costs are relatively low. Larger turbines in ideal windy locations can achieve LCOE of $30-60 per MWh.
- Natural Gas - Burning natural gas in combined cycle power plants is cost effective due to low fuel costs. CCGT LCOE is around $40-70 per MWh.
- Coal - Despite its high emissions, coal continues to provide cheap electricity in many regions, with LCOE of $60-100 per MWh.
- Solar PV - Solar panel costs have declined dramatically. Utility-scale solar in sunny areas can attain LCOE of $40-70 per MWh.
More expensive sources of electricity include oil/diesel generators, biomass power, nuclear energy, and building renewables like solar or wind in suboptimal locations. So in summary, hydro, geothermal, wind and natural gas tend to be the cheapest options for grid power generation with current technology.
Crude Oil Generation Plant
Here is an estimate of the capital cost for a 10MW electricity generation plant running on crude oil:
- For small-scale oil power plants, capital costs typically range from $1500-$2000 per kW of capacity.
- For a 10MW plant, the capacity-based costs would be:
- 10,000 kW x $1500 per kW = $15 million
- 10,000 kW x $2000 per kW = $20 million
- The crude oil boiler/combustor system likely costs around $2 million for 10MW scale.
- Turbines, generators and power system equipment adds $5-10 million.
- Balance of plant, construction, site development, permitting, engineering etc can cost $5-10 million.
- So the total capital cost would likely range from:
- $15 million + $10 million + $10 million = $35 million (on the lower end)
- $20 million + $10 million + $10 million = $40 million (on the higher end)
So in summary, the total installed capital cost for a 10MW crude oil power plant potentially ranges from $35 million to $40 million, with the per kW cost of the power generation equipment being the largest component. There are also significant ongoing fuel and O&M costs.
Crude Oil
Crude Oil is super bad for the environment
- Crude oil price: $90 per barrel
- 150 kg per barrel
- Energy density: 45 MJ/kg
- Power plant efficiency: 38%
- Oil required per kWh: 0.092 kg/kWh
- Fuel cost per kWh:
- 092 kg/kWh x $90 per barrel / 150 kg per barrel = $0.068
- O&M cost per kWh: $0.02
- Total cost per kWh:
- Fuel cost: $0.068
- O&M cost: $0.02
- Total: $0.088 per kWh
Conclusion: cost would be around $0.12 if we take into consideration price of plant.
Crude oil challenging for environment
There are a few key reasons why using crude oil for electricity generation is generally considered bad for the environment:
- Burning oil produces air pollutants like sulfur dioxide and nitrogen oxides that can cause acid rain and respiratory illnesses. Refining and transport also increase localized air pollution.
- Burning crude oil products like fuel oil or diesel to generate electricity emits high levels of carbon dioxide (CO2). Per unit of electricity, oil releases over 50% more CO2 than natural gas and almost double the emissions of renewable sources like solar or wind power.
- Crude oil has a very high carbon-to-hydrogen ratio compared to other fuels, so burning it results in especially high CO2 outputs. This significantly contributes to rising atmospheric greenhouse gas levels and climate change.
- Extracting, refining and transporting crude oil to turn it into usable fuel requires massive amounts of energy itself. The whole supply chain has heavy environmental impacts. Additional emissions and pollution occur before the oil is even burned for electricity.
- Crude oil is a non-renewable resource that takes millions of years to form naturally. Using it solely for electricity generation is considered a wasteful use of a limited resource that could otherwise be utilized for transportation or chemical production.
- Infrastructure like oil-fired power plants promote continued dependency on crude oil instead of transitioning the electricity sector towards renewable energy sources that have much lower lifecycle emissions.
- Spills or accidents in extracting, refining, or shipping crude oil to generate electricity can have devastating environmental consequences, harming ecosystems on land and in the ocean.
So while oil-based electricity provided an economical option in the past, environmental awareness and cleaner alternatives now available make continued large-scale use of crude oil for power generation highly unsustainable and polluting.
Diesel Generator impact on Environment
Diesel electricity generation is considered bad for the environment for several reasons due to the negative impact it has on air quality, greenhouse gas emissions, and human health. Here are some key reasons why diesel-based electricity generation is harmful:
- Air Pollution: Diesel engines emit a variety of pollutants, including particulate matter (PM), nitrogen oxides (NOx), sulfur dioxide (SO2), and volatile organic compounds (VOCs). These pollutants can lead to poor air quality, smog formation, and respiratory problems in humans.
- Particulate Matter: Diesel engines emit fine particulate matter (PM2.5), which are tiny particles suspended in the air. These particles can penetrate deep into the lungs and even enter the bloodstream, causing a range of health issues, including respiratory diseases, cardiovascular problems, and premature death.
- Nitrogen Oxides (NOx): Diesel engines produce significant amounts of nitrogen oxides (NOx), which contribute to the formation of ground-level ozone and smog. NOx emissions can worsen respiratory conditions, irritate the respiratory system, and impair lung development in children.
- Greenhouse Gas Emissions: Diesel engines are fossil fuel-based and emit carbon dioxide (CO2) and other greenhouse gasses when burned. CO2 is a major contributor to global climate change and is a primary driver of the Earth's warming, leading to temperature rise, sea level rise, and extreme weather events.
- Black Carbon: Diesel engines emit black carbon, a type of particulate matter that contributes to air pollution and has a warming effect on the atmosphere. Black carbon settles on snow and ice, reducing their reflectivity (albedo) and accelerating melting.
- Environmental Damage: The extraction, production, and transport of diesel fuel contribute to environmental damage, including habitat destruction, water pollution, and ecosystem disruption. Oil spills during extraction and transport can harm aquatic and terrestrial ecosystems.
- Noise Pollution: Diesel generators are noisy and can contribute to noise pollution in both urban and rural areas. Noise pollution can have negative impacts on human health, including stress, sleep disturbances, and cardiovascular issues.
- Limited Renewable Energy Integration: Relying on diesel generators hinders the transition to cleaner and more sustainable energy sources like renewable energy (solar, wind, hydro) because it maintains dependency on fossil fuels.
To mitigate these environmental impacts, it's important to shift towards cleaner and more sustainable energy sources, such as renewable energy and grid-connected electricity. This transition not only helps reduce harmful emissions but also contributes to global efforts to combat climate change and improve air quality.
Diesel Generator Consumption
Here are some details on the typical fuel usage and consumption of a 1MW diesel generator
1MW = 1 mega watt
- At full 1MW load, a diesel generator will consume approximately 250-280 liters/hour of diesel fuel.
- This is based on a specific fuel consumption of around 0.25 - 0.28 liters/kWh for modern diesel gensets in this size range.
- So for full 1MW output, the fuel burn rate is 250-280 liters per hour.
- Over 24 hours of continuous 1MW generation, the consumption would be ~6,000 - 6,700 liters of diesel.
- At lower load factors like 50% (500 kW output), the consumption decreases proportionally to 130-140 liters/hour.
- Fuel usage also depends on generator efficiency and load level - lighter loads increase specific consumption.
- Diesel has a density of 0.83 kg/liter. So 6,500 liters equates to ~5,400 kg or 5.4 metric tons per day.
- Additional factors like ambient temperature can also affect the fuel consumption rate.
So in summary, at full rated load a 1MW diesel generator uses 250-280 liters/hour of diesel which works out to ~6,500 liters or 5.4 tons per day. The fuel rate scales linearly with load. Efficiency is better at higher utilization.
Diesel prices
The cost of 1 metric ton of diesel fuel can vary significantly by country based on factors like government subsidies, taxes, supply and demand dynamics, and more. Here are some representative diesel prices per ton in different countries:
- United States - $800-$900 per ton
- China - $700-$800 per ton
- Japan - $900-$1000 per ton
- Germany - $1000-$1200 per ton
- India - $600-$700 per ton
- Saudi Arabia - $400-$500 per ton (subsidized)
- Russia - $500-$600 per ton
- Brazil - $900-$1000 per ton
- South Africa - $700-$800 per ton
- Australia - $800-$900 per ton
As a global commodity, diesel prices fluctuate regularly based on crude oil prices and currency exchange rates. But the prices range widely by country due to variations in fuel taxes, local market conditions, and national pricing policies. The figures above give a general idea of current diesel tonnage costs in various major countries. Prices are often available per liter or gallon locally.
Electricity Cost Based on Fuel
Parameters
- Diesel fuel price: I used $1000 per metric ton, which is a representative global industrial price. Fuel prices vary by region.
- Density of diesel: 0.83 kg/L is the standard density. This converts volume in liters to mass in kg.
- Energy density: 36 MJ/L is the energy content per liter of diesel. This is an important factor.
- Generator efficiency: 40% is a typical efficiency of converting the diesel fuel energy to electrical energy. Good generators range from 38-42% conversion efficiency.
- Fuel consumption: 0.28 L/kWh is the estimated diesel consumption rate for the generator size. The generator datasheet provides this specification.
- Fuel energy input per kWh: By dividing the 0.28 L/kWh by the 0.83 kg/L density, we get the kg of diesel fuel input per kWh output. This shows the physical energy content.
- Fuel cost per kWh: Multiplying the kg/kWh by the fuel cost per kg ($1000 per ton divided by 1000 kg per ton) calculates the literal fuel cost to generate each kWh of electricity.
- O&M cost: Operation, maintenance and other costs add about 10% typically.
The result:
- Diesel fuel price: $1000 per metric ton
- Density of diesel: 0.83 kg/L
- Energy density: Approximately 36 MJ/L
- Generator efficiency: 40%
- Fuel consumption: 0.28 L/kWh generated
- Fuel energy input per kWh generated:
- 28 L / 0.83 kg/L = 0.34 kg per kWh
- Fuel cost per kWh:
- 34 kg x $1000 per ton / 1000 kg per ton = $0.34 per kWh
Total cost including operational cost ~$0.38 per kWh
Biomass needed
To generate 1 megawatt (MW) of electricity per hour from biomass requires approximately 1,000 kilograms (or 1 metric ton) of biomass fuel.
Here's a breakdown of the math:
- 1 MW of power = 1,000,000 watts
- With a typical biomass power plant electrical efficiency of around 25%, it takes 4 units of fuel energy to generate 1 unit of electrical energy.
- The energy content of biomass fuels varies by source, but a typical value is about 18 GJ per metric ton (at 10% moisture content).
- So to generate 1 MW of power for 1 hour requires:
1,000,000 W x 1 hr = 1,000,000 Wh = 3,600,000 kJ
At 25% efficiency, the fuel energy required is: 3,600,000 kJ / 0.25 = 14,400,000 kJ
With biomass containing 18 GJ/ton = 18,000 kJ/kg
The biomass fuel required is: 14,400,000 kJ / 18,000 kJ/kg = 800 kg, or approximately 1 metric ton.
So in summary, generating 1 MW of power from biomass for 1 hour requires burning approximately 1 ton of biomass fuel. The actual amount can vary slightly based on the biomass source and moisture content.
Cost per KWH
Here is the cost per kWh breakdown for a 1 MW biomass power plant, with the numbers formatted more clearly:
Assumptions:
- 1 MW capacity
- 90% capacity factor
- 7,884 MWh annual generation
- $3,000,000 capital cost
- 10% interest rate on capital
Biomass Cost: $20/tonne
- Annual biomass fuel cost: 7,884 tonnes x $20/tonne = $157,680
- Fixed O&M cost: $300,000
- Variable O&M cost: 7,884 MWh x $0.02/kWh = $157,680
- Annual capital cost:
10% of $3,000,000 = $300,000 - Total annual cost = $915,360
- Cost per kWh = Total annual cost / Annual generation = $915,360 / 7,884 MWh = $0.116 per kWh
Biomass Cost: $100/tonne
- Annual biomass fuel cost: 7,884 tonnes x $100/tonne = $788,400
- Fixed O&M cost: $300,000
- Variable O&M cost: $157,680
- Annual capital cost: $300,000
- Total annual cost = $1,546,080
- Cost per kWh = Total annual cost / Annual generation = $1,546,080 / 7,884 MWh = $0.196 per kWh
Hemp as Biomass
The energy content of industrial hemp is equivalent to that of woody biomass, approximately 7,247 BTUs / pound or 16.9 megajoules / kilogram.
Hemp grows fast and is capable of absorbing 22 tonnes of CO2 per hectare under the right conditions. In some regions it is possible to produce 3 crops per year.
In one season a hectare of healthy soil can produce as much as 12 tonnes of hemp biomass with an energy equivalent of approximately 202,800 megajoules (192,217,312 BTUs) or 56,333.33 kilowatt hours.
An EPL with a 10 hectare hemp TBR would generate 281,666 kilowatt hours and sequester 220 tonnes of carbon dioxide.
Conclusion Per Season
- 220 tonnes of CO2 = 220*60 USD = 13200 USD
- 281 MW = 0.2 * 1000 * 281 = 56000 USD (if cost of energy is put on 0.2)
If 3x per year
- Need 1/(281*3/24/30/12) times the size = 10x = 100 hectares per MW continuous
- For 5 MW = 500 hectares = 5km2
Cost to produce Hemp Biomass
Here's an estimate on the cost to produce 1 metric tonne of hemp biomass:
- Hemp yields average around 8,000 kg/ha (around 3.5 tons/acre)
- Input costs for hemp production:
- Seeds: $500/ha
- Fertilizer: $150/ha
- Equipment, labor, other overhead: $800/ha
- Total input costs per hectare: $1,450
- For a yield of 8,000 kg/ha:
- Input cost per kg hemp = $1,450 / 8,000 kg = $0.18
- So input cost per metric tonne (1,000 kg) hemp = $180
- Additional harvesting/transport costs estimated around $30/tonne
- Total production cost = $180 + $30 = $210 per metric tonne
So in summary, current industry estimates put the total cost to produce 1 metric tonne of hemp biomass at around $210. This can vary based on yields, farming practices, and equipment/labor costs. But overall, hemp provides a relatively low-cost biomass feedstock for energy production.
If fertilizer cost is $0 and overhead is $400 per hectare then 1 metric tonne of hemp biomass:
- Hemp yields average around 8,000 kg/ha
- Input costs for hemp production:
- Seeds: $500/ha
- Fertilizer: $0
- Overhead: $400/ha
- Total input costs per hectare: $500 + $0 + $400 = $900
- For a yield of 8,000 kg/ha:
- Input cost per kg hemp = $900 / 8,000 kg = $0.113
- So input cost per metric tonne (1,000 kg) hemp = $113
- Additional harvesting/transport costs estimated around $30/tonne
- Total production cost = $113 + $30 = $143 per metric tonne
With zero fertilizer cost and $400/ha overhead, the total estimated cost to produce 1 metric tonne of hemp biomass is approximately $143.
Other Biomass Sources
Here is an overview of some of the most cost-effective options for farming biomass to be used for electricity production:
- Short rotation woody crops like willow or poplar:
- Yield up to 8 dry tonnes/ha/year
- Require low inputs like fertilizer
- Cost around $50-60/dry tonne
- Perennial grasses like switchgrass or miscanthus:
- Yield up to 20 dry tonnes/ha/year
- Low input costs, well-suited to marginal land
- Cost around $40-60/dry tonne
- Agricultural residues like straw and corn stover:
- Already produced as byproducts of food crops
- Cost just $20-40/dry tonne
- Lower yields than dedicated energy crops
- Fast growing trees like eucalyptus:
- Yield 10-40 dry tonnes/ha/year depending on climate
- Cost around $40-50/dry tonne
- Hemp:
- Yields around 8 dry tonnes/ha/year
- Low input costs
- Cost around $100-150/dry tonne
The lowest cost options are agricultural residues, but availability may be limited. Perennial grasses like switchgrass provide a good combination of high yields and low costs.
Overall, the optimal feedstock depends on local climate, land availability, and production costs. But several options can provide biomass at costs competitive with other fuel sources.
Wind Energy
There is no single minimum wind speed threshold for electricity production from wind turbines, as it depends on the turbine size, design, height, and other factors. However, here are some general guidelines on the minimal wind speeds required:
- Most commercial scale horizontal axis wind turbines today need average annual wind speeds of at least 6-7 miles per hour (mph) or 10-11 km/h to be viable for electricity generation.
- Smaller residential vertical axis turbines can start generating power at lower wind speeds of around 5 mph or 8 km/h. But their energy output is still low at this speed.
- For commercial scale turbines, the cutoff-in speed is around 7-9 mph (11-14 km/h) when they will begin spinning and generating some power. Output is limited at these minimum speeds.
- The optimal operating range for full power generation is around 15-35 mph (24-56 km/h) for large modern utility-scale wind turbines.
- Cutoff-out speeds when turbines shut down for safety are usually 55-65 mph (88-105 km/h).
- For a wind farm to produce a substantial amount of its maximum capacity, average wind speeds need to be closer to the optimal range and have at least 12-13 mph (19-20 km/h) averages.
- Areas with average annual wind speeds of less than 6-7 mph are generally not suitable sites for wind farms without taller turbines that can capture higher altitude winds.
So while turbines can start generating at lower wind speeds, significantly productive wind energy generation requires careful siting in locations with adequately strong wind resources. Higher turbines can take advantage of faster winds at increased heights.
Is Zanzibar suitable?
Here are some details on average wind speeds in Zanzibar:
- The average annual wind speed across Zanzibar is approximately 9-10 knots or 10-12 mph (16-19 km/h).
- Wind speeds are highest during the kaskazi season from December to March when the prevailing wind blows from the northeast. Average wind speeds can reach 15-20 knots (17-23 mph or 28-37 km/h) during this period.
- The lowest wind speeds occur during the monsoon season from April to early June when wind direction reverses and blows from the southwest. Speeds can drop below 5 knots (6 mph or 9 km/h) on average.
- Winds pick up again during the kusi season from June to September with averages of 10-15 knots (11-17 mph or 18-28 km/h).
- The inland areas of the islands tend to have lower wind speeds compared to along the coastlines.
- The highest average wind speeds are observed in northern and eastern coastal regions which are most exposed to the prevailing winds. Sites like Ras Nungwi see higher consistent wind.
- Outside of the main cities, much of Zanzibar remains sparsely populated. Offshore winds are less obstructed allowing for harnessing of wind energy.
Summary
So in summary, Zanzibar has modest average wind speeds suitable for small-scale wind turbines, especially in coastal areas and during the windy kaskazi season. Large scale wind farms would require especially windy sites.
Based on the moderate average wind speeds in Zanzibar, there is some potential for wind energy, but it may not be an ideal location for large-scale wind farm development:
- The annual average wind speeds of 9-12 mph are on the lower end of what is considered economically viable for utility-scale wind power. The minimum is usually around 10-11 mph.
- However, wind speeds do reach optimal generation levels for periods during the kaskazi and kusi seasonal winds. Target speeds are around 15-35 mph for most large turbines.
- Smaller scale wind development using smaller turbines that can operate at lower wind speeds may be more feasible across more areas of Zanzibar.
- The offshore winds are likely stronger than onshore and could support offshore wind farms. But offshore development costs are higher.
- Being an archipelago, the land area is constrained, further limiting onshore wind farm potential. And competing land uses like tourism and agriculture reduce suitable open sites.
- Interconnection to transmit wind power from Zanzibar to mainland Tanzania may be challenging and costly. Local demand may not be enough to justify large projects.
- Wind project permits and policy frameworks are still emerging in Tanzania, adding development uncertainty.
So in summary, while Zanzibar has wind resources that could be harnessed in a limited capacity, it is not an ideal wind power location compared to sites with stronger and more consistent wind speeds. Smaller distributed wind development is likely a better fit than major utility-scale wind farms for Zanzibar.
The amount of fuel required to produce 1 megawatt-hour (MWh) of electricity depends on the type of fuel and the efficiency of the power plant. Here are some approximate fuel requirements for different technologies:
- Natural gas power plant - Requires approximately 10,000 cubic feet (cf) of natural gas to produce 1 MWh of electricity. At 35-45% efficiency.
- Coal power plant - Requires around 147-170 kg of coal to produce 1 MWh. Typical efficiency of 33-40%.
- Oil power plant - Needs about 6.3-7 barrels, 410-450 kg of crude oil for 1 MWh generation. At 30-37% efficiency.
- Biomass power plant - Requires 1,000-1,500 kg of biomass material for each MWh. 30% efficiency.
- Nuclear power - Uranium fuel consumption is very low, only 4-6 grams per MWh generated. But very high capital costs.
- Hydroelectric dam - No fuel required, generation based on water flow and dam height.
- Wind turbines - No fuel input, wind kinetic energy is transformed to electricity.
- Solar PV - Also no fuel cost, converts sunlight directly to electricity.
So in summary, natural gas has the lowest MWh fuel input, followed by coal and oil. Non-fuel renewables like hydro, wind and solar have minimal operational costs for continuous generation.
Cost for solar power plant
Here is an overview of the typical capital costs for a 1MW solar photovoltaic power plant:
- Solar modules - $0.5 - $0.6 million for crystalline silicon panels rated at 5W per sqft.
- Inverters - $50,000 - $100,000 for grid-tied inverter system and controls.
- Mounting system - $50,000 - $150,000 for fixed tilt or tracking mounts.
- Electrical equipment - $50,000 - $100,000 for transformers, switchgear, monitoring.
- Site preparation - $50,000 - $100,000 for grading, access, perimeter.
- Installation labor - $50,000 - $100,000 depending on complexity.
- Permitting and engineering - $50,000 - $100,000.
- Total: Approximately $800,000 to $1.2 million.
The wide range accounts for differences in site location, labor rates, type of PV panels, mounting system and other factors. Economies of scale provide some cost savings for larger utility-scale systems.
1MW solar PV power plant expressed in terms of cost per square meter:
- Solar modules - $100 - $120 per sqm. Crystalline silicon panels are typically rated at 200W per sqm.
- Inverters - $10 - $20 per sqm. Sized based on peak capacity.
- Mounting system - $10 - $30 per sqm. Depends on mounting type.
- Electrical equipment - $10 - $20 per sqm.
- Site preparation - $10 - $20 per sqm. Grading and access roads.
- Installation labor - $10 - $20 per sqm. Based on crew size.
- Permitting/engineering - $10 - $20 per sqm.
- Total: Approximately $160 to $250 per sqm.
The total PV system size for 1MW is typically 4000 - 5000 sqm depending on the solar irradiance availability.
Land needed
Here are some conservative estimates for the land area needed for a 5 MW solar PV facility in Africa:
- Assume a location in sub-Saharan Africa with an average solar insolation of 5.5 kWh/m2/day
- Use a conservative capacity factor of 15% for the solar PV system
- A solar panel with 20% efficiency and 1 m2 area will produce on average: 5.5 kWh/m2/day x 0.2 efficiency = 1.1 kWh per day 1.1 kWh/day x 365 days x 0.15 capacity factor = 61.2 kWh per year
- So each 1 m2 of solar panels will generate about 61.2 kWh per year
- The solar facility needs to generate 5 MW x 24 hours x 365 days = 43,800 MWh per year
- So total solar panels needed: 43,800,000 kWh / 61.2 kWh/m2 = 715,195 m2
- Add ~20% extra land for spacing, access roads etc.
- Total land area required: 715,195 m2 x 1.2 = 858,235 m2
- Which is 86 hectares or 0.86 km2
So for a 5 MW solar PV facility with a 15% capacity factor in sub-Saharan Africa, a conservative estimate is around 86 hectares or 0.86 km2 of land area.
If we only need it for 8 hours, then we can do ⅓
- We need 300,000m2 land for solar for the datacenter
Zanzibar suitable?
Here are a few factors that indicate Zanzibar has relatively good suitability for solar energy production:
- Solar Irradiation - Zanzibar receives average solar insolation of around 5.5-6.0 kWh/m2 per day. This is considered a good level of solar resource for photovoltaic electricity generation.
- Close to Equator - At around 6 degrees South latitude, Zanzibar's location close to the equator provides consistent solar exposure throughout the year.
- Low Rainfall - The archipelago experiences lower rainfall amounts compared to other tropical regions. This allows for more days of direct sun exposure for solar panels versus cloudier areas.
- Land Availability - As an archipelago, land area is limited for large-scale solar farms. But the islands have ample unused land that could host small- to medium-scale solar developments. Rooftop solar also has significant potential.
- Growing Electricity Demand - Zanzibar has an emerging economy with increasing power demand that could benefit from distributed solar generation to supplement the grid.
- Decreasing Solar Costs - The global decline in solar PV costs makes adoption more feasible compared to past years.
- Supportive Policies - Tanzania has begun establishing policies like tax exemptions and net metering that can incentivize solar generation.
sunlight per day
Here are some details on the average amount of sunlight per day in Zanzibar that is usable for solar energy:
- Zanzibar has an equatorial location off the east coast of Africa and receives abundant sunlight throughout the year.
- Average peak sun hours per day (hours with direct sunshine) is around 6-7 hours.
- For solar photovoltaic (PV) panels oriented appropriately, the average daily solar irradiation is about 5.5-6.0 kWh/m2.
- This solar irradiation includes both direct and diffuse sunlight. PV panels can utilize both components for electricity generation.
- Assuming a conservative 15% conversion efficiency for solar panels, the average usable sunlight is around 0.825 - 0.9 kWh/m2 per day.
- More advanced solar cell efficiencies up to 22% could provide over 1.2 kWh/m2 of usable electricity generation per day.
- Seasonal variation in usable sunlight is low due to Zanzibar's equatorial location. Output is fairly consistent throughout the year.
- Some cloud cover and humidity during the April-May rainy periods can slightly reduce usable sunlight.
So in summary, Zanzibar benefits from excellent solar resources with approximately 6-7 peak sun hours and 5.5-6 kWh/m2 of daily irradiation. After accounting for real-world system efficiencies, on average 0.8 - 1.2 kWh/m2 of this sunlight can be utilized daily for electricity generation using solar photovoltaic panels.
Cost
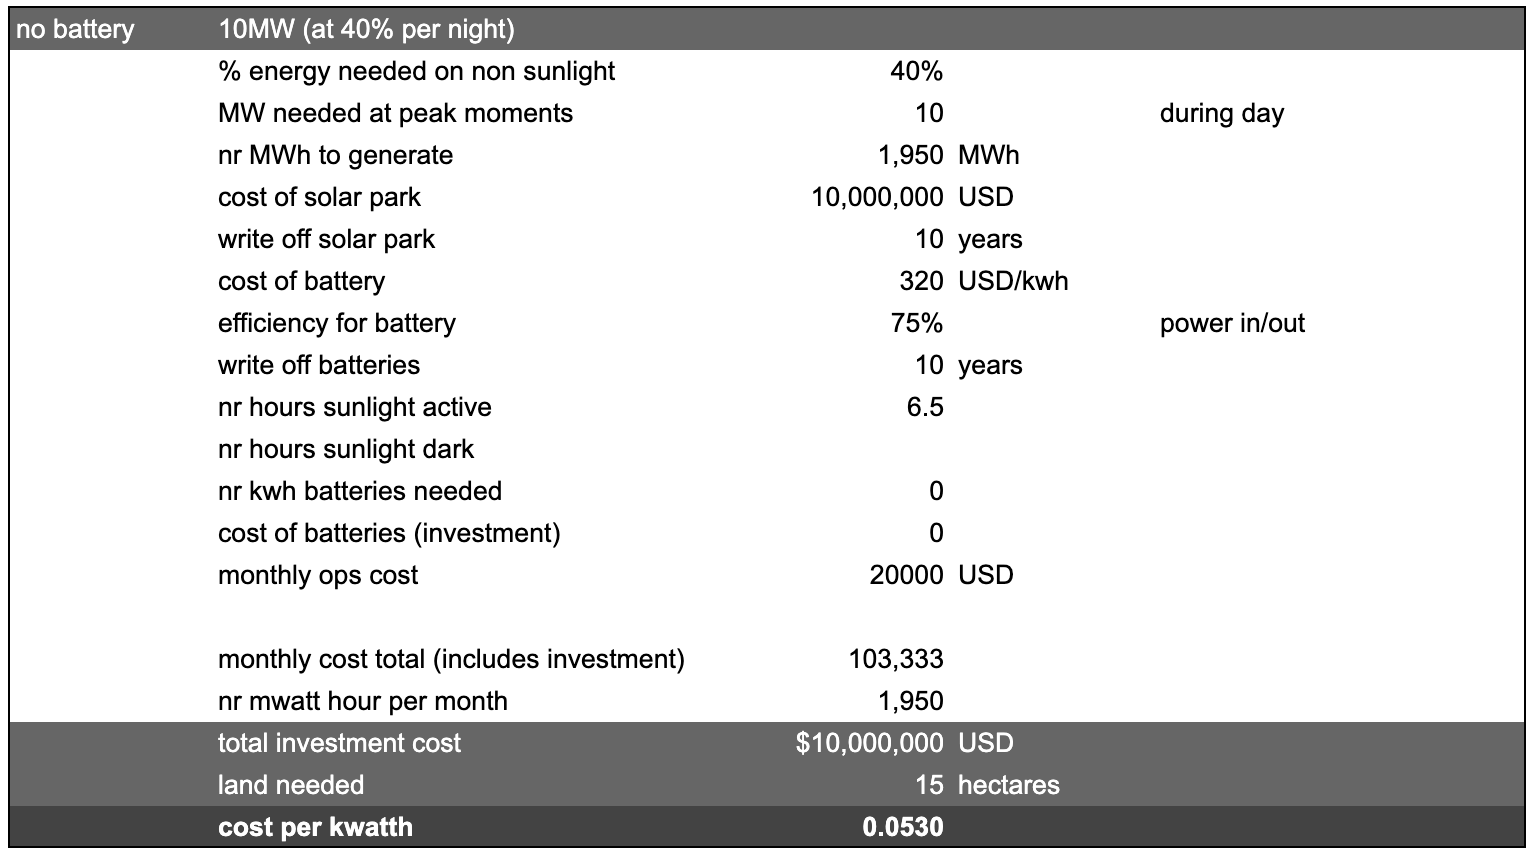
+- 0.05 USD per kwatth, which is very good but thats only for when its sun.

+- 0.08 USD per kwatth, which is still very good, but only 40% of capacity usable when there is no SUN
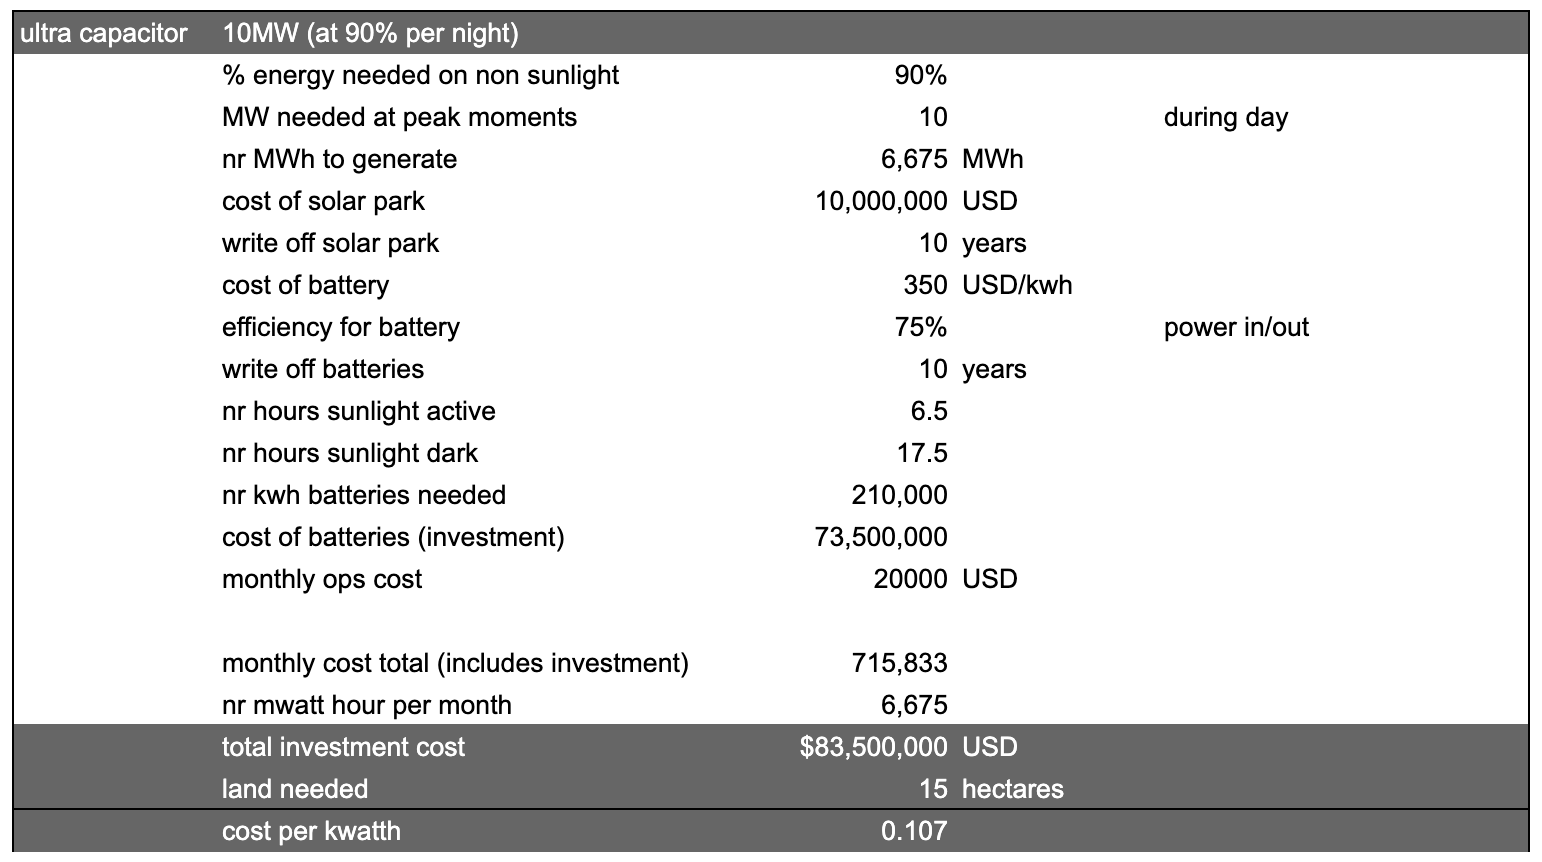
land size reuired for solar
The size of land required to generate 1 megawatt-hour (MWH) of solar energy depends on several factors, including the efficiency of the solar panels, the solar irradiance at the location, and the climate conditions. Here's a rough estimate based on typical values:
- Solar Panel Efficiency: The efficiency of solar panels varies, but let's assume an average efficiency of around 15-20%.
- Solar Irradiance: The amount of sunlight energy received at a particular location also varies. Let's consider an average value of around 5 kWh/m²/day.
With these assumptions, you can estimate the size of land required using the formula:
Land Area (in square meters) = Energy Required (MWh) / (Solar Panel Efficiency * Solar Irradiance)
Converting the energy from MWh to kWh:
1 MWh = 1000 kWh
Let's plug in the values:
Land Area (m²) = (1000 kWh) / (0.15 * 5 kWh/m²/day)
Calculating:
Land Area ≈ 13333.33 m² or 1.33 hectares (since 1 hectare = 10000 m²)
So, based on these assumptions, you would need approximately 1.33 hectares of land to generate 1 MWh of solar energy per day. Keep in mind that this is a simplified estimate, and actual requirements may vary based on location-specific factors, panel efficiency, and other considerations.
Cost for batteries
Here is a realistic estimate of the current costs for battery energy storage including capital and operational expenses:
- Lithium-ion batteries capital cost today ranges from $100/kWh to $300/kWh for grid-scale systems larger than 1MWh.
- A realistic mid-range capital cost is around $185/kWh.
- Fixed O&M costs are typically $10-$15/kW-year.
- Variable O&M costs around 0.5-1 cent/kWh cycled.
- Annual throughput of 250-500 cycles depending on usage.
- Battery lifespan is 5-15 years before replacement needed.
- So for a 10MWh system the costs over 10 years would be:
- Capital: 10,000 kWh x $185/kWh = $1.85 million
- Fixed O&M: $12.5/kW-year x 1000 kW = $125,000/year x 10 years = $1.25 million
- Variable O&M: Avg 400 cycles/year x 10 years x $0.0075/kWh = $300,000
- Total 10-year cost = $3.4 million
- Levelized cost around $340/MWh over 10 years for this system.
Actual costs vary widely based on battery chemistry, scale, location, ancillary equipment and project specifics. But this provides a realistic estimate for modeling purposes. Let me know if you need any other details!
Here are some of the lowest cost battery storage technologies for grid-scale electricity:
- Lithium-ion batteries - $100 - $150 per kWh for utility scale. Costs continue to decrease rapidly.
- Flow batteries - $120 - $200 per kWh fully installed. Lowest cost is vanadium redox at $150/kWh.
- Lead acid batteries - Around $100 per kWh. Only viable for shorter duration needs.
- Compressed air energy storage - $50 - $100 per kWh based on site geology. Requires underground caverns.
- Pumped hydro storage - $100 - $300 per kWh. Highly site dependent. Cheapest at scale.
- Hydrogen storage - $150 - $300 per kWh. Requires hydrogen production and fuel cells. Emerging option.
So in summary, lithium-ion batteries offer the lowest cost currently at around $100-$150/kWh at utility scale. Their costs have fallen fast and are expected to continue improving. For long duration storage, pumped hydro and compressed air can be most economical depending on site suitability.
Ultra Capacitors
Here are some key points about using ultracapacitors for large-scale energy storage:
- Ultracapacitors can store and discharge electricity very quickly, making them well-suited for short duration load leveling and frequency regulation applications.
- They have high power density (up to 10 kW/kg) but relatively low energy density (around 5-10 Wh/kg), so large banks would be needed for bulk energy storage.
- Ultracapacitors have high cycle life (>1 million cycles) and high round-trip efficiency (95%+) which is attractive.
- Cost is still relatively high compared to Li-ion batteries at around $200-300/kWh for the ultracapacitor system. Rapidly improving though.
- Large ultracapacitor banks connected to the grid often use a hybrid system configuration with batteries or other storage to optimize performance and costs.
- Ultracapacitors provide excellent complement to batteries by handling high power transients and smoothing fluctuations.
- Safety advantages over batteries with no fire/explosion risks. More environmentally friendly.
- Could potentially reduce the required size of substation equipment like transformers and switches.
- Challenges include developing pilots to demonstrate benefits, reducing costs further, integrating into grid infrastructure and energy markets.
So in summary, ultracapacitors have promising characteristics for large scale energy storage but may be better suited to specific high power applications rather than bulk energy storage due to cost and energy density limitations currently. Their role alongside batteries warrants further exploration.
H2O
Cost to generate H20
Here is an estimate of the cost to generate 1 liter of H2O (water) from electricity:
- The chemical reaction for water electrolysis is:
2H2O --> 2H2 + O2 - This requires an input of 286 kJ of electricity per mole of water.
- One mole of water = 18 grams = 18 mL of water
- So to generate 1 liter of water (1000 mL) requires:
1000 mL / 18 mL per mole = 55.6 moles - Electricity input required = 55.6 moles x 286 kJ per mole = 15,930 kJ
- 15,930 kJ = 4.42 kWh of electricity
- At an electricity price of $0.10 per kWh:
Cost for 4.42 kWh = $0.44
So the estimated cost to produce 1 liter of H2O from water electrolysis powered by electricity is around $0.44, assuming an electricity rate of $0.10 per kWh.
This does not include the capital cost of the electrolyzer system. But in terms of just operating costs, the electricity required to split water into hydrogen and oxygen to generate 1 liter of H2O would be around $0.44 at current typical electricity prices.
to generate 1 liter of H2O from electricity via water electrolysis at an electricity rate of $0.15 per kWh:
- The electricity input required to generate 1 liter of H2O is 4.42 kWh, based on the previous calculation.
- At a cost of $0.15 per kWh:
- Cost for 4.42 kWh at $0.15/kWh = 4.42 * $0.15 = $0.66
So with an electricity price of $0.15 per kWh, the estimated cost to produce 1 liter of H2O through electrolysis would be $0.66.
H20 Cost
For a large commercial electrolyzer:
- Capacity: 500 liters H2O/hour
- System cost around $400,000-$600,000
- Utilizing proton-exchange membrane (PEM) electrolysis cells
- Cell stack cost around $600 per kW
- 500 liters/hr requires around 60 kW
- Cell stack cost = 60 kW x $600 per kW = $36,000
- Balance of system adds ~2X cost
- Total system cost ~$400,000
Here is the cost estimate re-done for $0.15/kWh electricity and formatted more clearly:
Assumptions:
- Electrolyzer efficiency: 70%
- Electricity cost: $0.15/kWh
- $400,000 electrolyzer capital cost
- 10 year amortization
- 5% interest
- 50% capacity factor
To store 1 MWh electricity as H2O:
- Electricity required: 1 MWh / 0.70 efficiency = 1.43 MWh
- Electricity cost (@ $0.15/kWh): 1.43 MWh x $0.15/kWh = $214.50
- H2O generated: 1.43 MWh x 278 g/MJ x 3600 MJ/MWh = 1,429 kg
- Annual amortized capital cost: $48,763
- Annual H2O production: 6,186 tonnes
- Capital cost per tonne H2O: $48,763 / 6,186 tonnes = $7.88
- Capital cost for 1.429 tonnes H2O: 1.429 tonnes x $7.88/tonne = $11.28
Total cost to store 1 MWh in H2O:
Electricity: $214.50 Capital: $11.28 Total: $225.78